Top Lithium Mining Companies (2026 Data)
Updated: August 2026 · Data year: 2025 · Primary sources: USGS Mineral Commodity Summaries 2026, company reports
Key figures for 2025
- 290,000 t — world lithium mine production (metal content, excl. US), up 31% year over year (USGS)
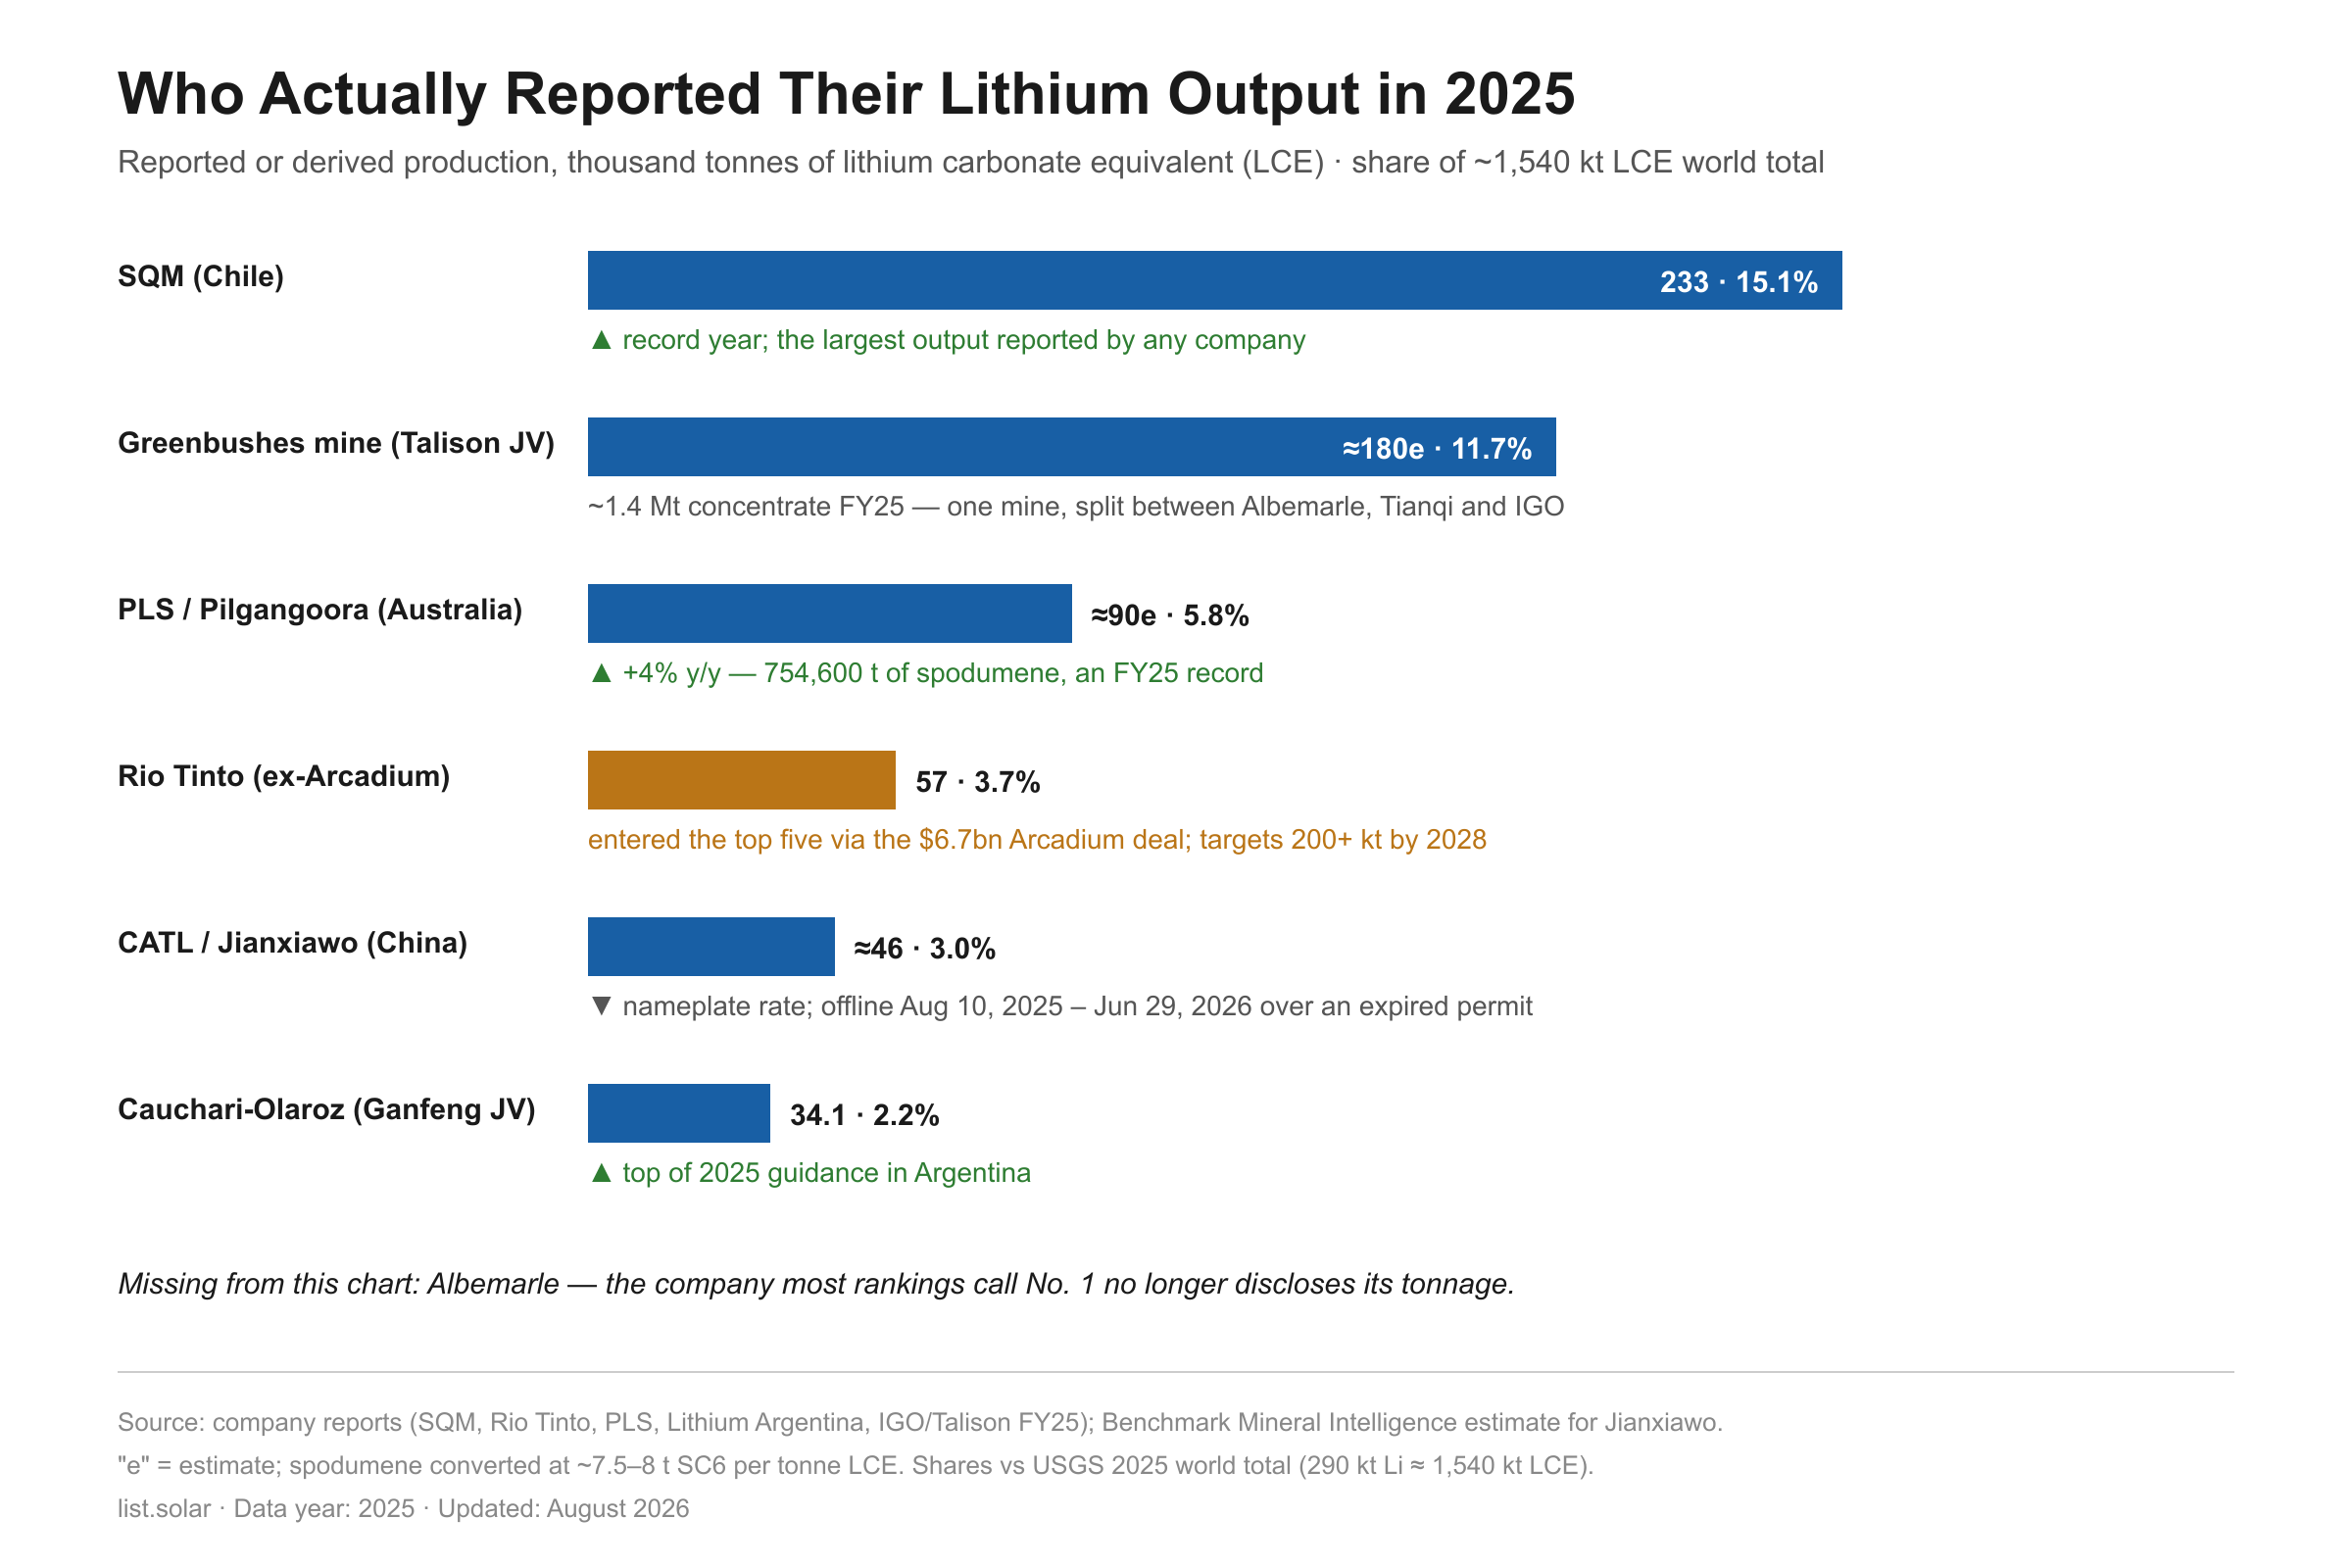
- 233,000 t LCE — SQM's 2025 output, the largest reported by any company
- $6.7 billion — what Rio Tinto paid for Arcadium Lithium to enter the top five in one deal
- ~3% of world supply — knocked offline when one CATL mining permit expired in August 2025
- ¥75,000 → ¥205,000/t — China lithium carbonate, January 2025 to the May 2026 peak
- 88% — share of global lithium demand that goes into batteries (USGS)
The lithium industry got a new No. 1 in 2025, and most rankings have not caught up. SQM of Chile produced roughly 233,000 tonnes of lithium carbonate equivalent (LCE), a company record, while Albemarle — the name that tops nearly every "biggest lithium company" list — stopped disclosing its tonnage altogether. Around them, the whole market ran hot: world mine production jumped 31% to about 290,000 tonnes of lithium content even as the average US contract price for battery-grade carbonate fell 31% to $9,000 per tonne. Producers answered a price collapse by digging faster.
The ranking below reflects two other shifts that reshaped the league table. Rio Tinto closed its $6.7 billion purchase of Arcadium Lithium in March 2025 and became a top-five lithium producer overnight. And the single most powerful force in lithium pricing turned out to be a company that appears in no mining index: battery maker CATL, whose Jianxiawo mine sat idle for ten months over an expired permit and moved global prices more than every Chilean expansion combined.
The top 10 lithium mining companies in 2025
Companies report output in incompatible units — LCE for brine producers, spodumene concentrate tonnes for hard-rock miners, nothing at all in Albemarle's case — so the table keeps each company's own reported figure and adds an LCE estimate only where the conversion is straightforward. Shares of world supply are our own calculation against the USGS world total of 290,000 t lithium content (roughly 1.54 million t LCE); the conversion logic is in the methodology section.
| # | Company | HQ | 2025 output (as reported) | ≈ kt LCE | Key assets |
|---|---|---|---|---|---|
| 1 | SQM | Chile | 233,000 t LCE produced (record) | 233 | Salar de Atacama; Mt Holland & Kwinana (Australia, JV) |
| 2 | Albemarle | US | Not disclosed; Q4 Energy Storage volumes +17% y/y | n/d | Salar de Atacama; 49% Greenbushes; 50% Wodgina; Silver Peak |
| 3 | Ganfeng Lithium | China | ~300 kt/yr lithium salt capacity; Cauchari-Olaroz 34,100 t; Goulamina 336,600 t conc. | ~130e | Cauchari-Olaroz, Mariana (Argentina); Goulamina (Mali); 50% Mt Marion |
| 4 | Tianqi Lithium | China | Via Talison: Greenbushes ~1.4 Mt conc. in FY25 | ~47e attrib. | 26% effective Greenbushes; Kwinana hydroxide; stake in SQM |
| 5 | Rio Tinto | UK/Australia | 57 kt LCE (46 kt attributable post-acquisition) | 57 | Fenix, Olaroz, Rincon (Argentina); Mt Cattlin; ex-Arcadium portfolio |
| 6 | PLS (ex-Pilbara Minerals) | Australia | 754,600 t spodumene, FY25 record | ~90e | Pilgangoora (P1000); 18% POSCO hydroxide JV, South Korea |
| 7 | Mineral Resources | Australia | Mt Marion guidance lifted to 370–400 kt conc.; Wodgina 50% | ~55e attrib. | 50% Wodgina; 50% Mt Marion; Bald Hill (care & maintenance) |
| 8 | IGO | Australia | Via Talison: share of Greenbushes ~1.4 Mt conc. FY25 | ~45e attrib. | 25% effective Greenbushes; 49% Kwinana JV |
| 9 | CATL | China | Jianxiawo ~46 kt LCE/yr nameplate; offline Aug 2025–Jun 2026 | ~28e | Jianxiawo lepidolite mine, Jiangxi; world's largest battery maker |
| 10 | Liontown Resources | Australia | >300 kt (wet) concentrate in first 11 months of operation | ~35e | Kathleen Valley (ramping toward 500 kt/yr) |
Output as reported by each company for calendar 2025 or FY2025 (Australian fiscal year, July 2024–June 2025, marked FY25). "e" = our estimate; "attrib." = attributable share of joint ventures. Conversion of spodumene concentrate to LCE per methodology below. Sources: company reports listed at the end.
SQM: the new No. 1 shares its crown jewel with the state
SQM produced about 233,000 t LCE in 2025 and closed the fourth quarter with record sales of 66,200 t, up 33% year over year. Full-year revenue reached $4.58 billion with net income of $588 million — modest numbers for a market leader, because prices spent most of the year near cycle lows before turning: SQM's realized price bottomed at $8.5/kg in Q3 and recovered to $10/kg in Q4. The bigger structural change came at year-end, when SQM folded its Salar de Atacama operations into Nova Andino Litio, the long-negotiated joint venture with state copper giant Codelco that secures its license beyond 2030 in exchange for allocating income from 33,500 t of lithium to the state. For 2026 the company targets 260,000 t of production.
Albemarle: still called the biggest, no longer proving it
Albemarle's Energy Storage segment posted Q4 net sales of $759 million, up 23%, on volumes up 17% and pricing up 6% — the first quarter in two years where both moved in its favor. Full-year segment EBITDA of $697 million was still 8% below 2024, a measure of how far prices had fallen. What Albemarle no longer publishes is tonnage, which makes its habitual No. 1 spot in third-party rankings an act of faith. Its asset base remains arguably the best in the industry: brine at the Salar de Atacama, 49% of the Greenbushes mine, half of Wodgina, and the only producing US lithium operation at Silver Peak, Nevada, plus a $90 million US Department of Defense award to expand domestic output.
Ganfeng: the year Mali started paying off
Ganfeng returned to profit in 2025 with net income of ¥1.61 billion against a ¥2.07 billion loss in 2024, on revenue of ¥23.1 billion, up 22%. The volume story sits outside China: the Cauchari-Olaroz brine operation in Argentina delivered 34,100 t of lithium carbonate, at the top of its 30,000–35,000 t guidance; the neighboring Mariana project entered production in February 2025; and the first phase of Goulamina in Mali produced 336,600 t of concentrate in its first full year. Add half of Australia's Mt Marion and a lithium salt capacity of roughly 300,000 t/yr, and Ganfeng remains the most vertically integrated producer on this list — mine to battery cell.
Tianqi and IGO: two names behind one mine
Neither Tianqi nor IGO operates a flagship mine outright; both draw their weight from Talison Lithium, operator of Greenbushes in Western Australia, which produced about 1.4 million t of spodumene concentrate in FY25 — the largest output of any lithium mine on earth. The ownership stack takes a diagram to explain: Albemarle holds 49% of Talison directly, while the other 51% belongs to Tianqi Lithium Energy Australia, itself a 51/49 venture between Tianqi and IGO. That leaves Tianqi with an effective 26% and IGO just under 25%. A third processing plant, CGP3, is being commissioned to lift capacity toward 2.4 million t/yr by late 2026, which would widen Greenbushes' lead over every rival regardless of whose logo is on the gate.
Rio Tinto: a top-five producer bought, not built
Rio Tinto spent a decade failing to build a lithium business organically — its Jadar project in Serbia stalled on local opposition — then solved the problem with a check. The $6.7 billion Arcadium acquisition closed on March 5, 2025, and by S&P Global's count handed Rio the world's third-largest lithium reserve base. First-year production reached 57 kt LCE (46 kt attributable from the March completion date), with record Q4 output at both the Fenix and Olaroz brine operations in Argentina. The growth pipeline is the point: a $2.5 billion expansion is taking Rincon to 60 kt/yr of battery-grade carbonate, and the group targets more than 200 kt/yr of capacity by 2028 — enough to challenge for the top spot within three years.
PLS: record volumes into a falling price
The company formerly known as Pilbara Minerals produced a record 754,600 t of spodumene concentrate in FY25, up 4% and above the top of guidance, even with its smaller Ngungaju plant mothballed. The price told the opposite story: the average realized price fell 43% year over year to $754.6/t, and revenue dropped 39% to A$769 million. Management's answer was scale and cost — the P1000 expansion lifted nameplate capacity to about 1 Mt/yr, unit costs fell toward A$540/t, and FY26 guidance calls for 820,000–870,000 t. PLS is the purest large-cap bet on spodumene prices on the ASX, for better and, through most of 2025, for worse.
Mineral Resources and Liontown: the rest of the Australian bench
Mineral Resources runs half of two major mines — Wodgina (with Albemarle) and Mt Marion (with Ganfeng) — and spent 2025 squeezing more from both: Mt Marion's FY25 guidance was lifted by 70,000 t to 370,000–400,000 t of concentrate, and Wodgina's recoveries hit 70% in the December quarter, when MinRes realized $1,094/t for SC6 — double what PLS was getting six months earlier, a snapshot of how fast the market turned. Liontown's Kathleen Valley, in its first 11 months, produced more than 300,000 t (wet) of concentrate and generated three consecutive quarters of positive operating cash flow during the worst pricing stretch of the cycle — a rare clean ramp-up in an industry that rarely delivers them.
CATL: the miner that isn't a mining company
CATL makes more lithium-ion batteries than anyone, and its Jianxiawo lepidolite mine in Jiangxi province produces roughly 46,000 t LCE a year — about 3% of world supply and by some estimates 8–10% of China's domestic output. On August 10, 2025, its safety production license expired, and the mine stopped. Chinese lithium carbonate futures more than doubled in the months that followed, at one point topping ¥200,000/t. The permit was reissued on June 29, 2026, and prices promptly fell almost 10% in two sessions. No mining company moved the 2025–26 lithium market as much as this one battery maker's paperwork.
The myth: "Albemarle is the world's largest lithium miner"
Nearly every ranking published in the last five years leads with Albemarle. The claim is now unverifiable at best. Albemarle stopped disclosing production tonnage; SQM, which does disclose, produced 233,000 t LCE in 2025 and is targeting 260,000 t in 2026. The confusion runs deeper than one company, because "biggest" hides three different questions. Biggest mine? Greenbushes, at ~1.4 Mt of concentrate — but it is split among Albemarle, Tianqi and IGO through two layers of joint ventures, so no single company books it. Biggest reserves? After the Arcadium deal, S&P Global puts Rio Tinto third behind Bolivia's state Comibol and SQM. Biggest influence on price? In 2025–26, demonstrably CATL. A ranking that answers only "whose name appears first in Google" measures marketing, not lithium.
World production: who mined the lithium in 2025
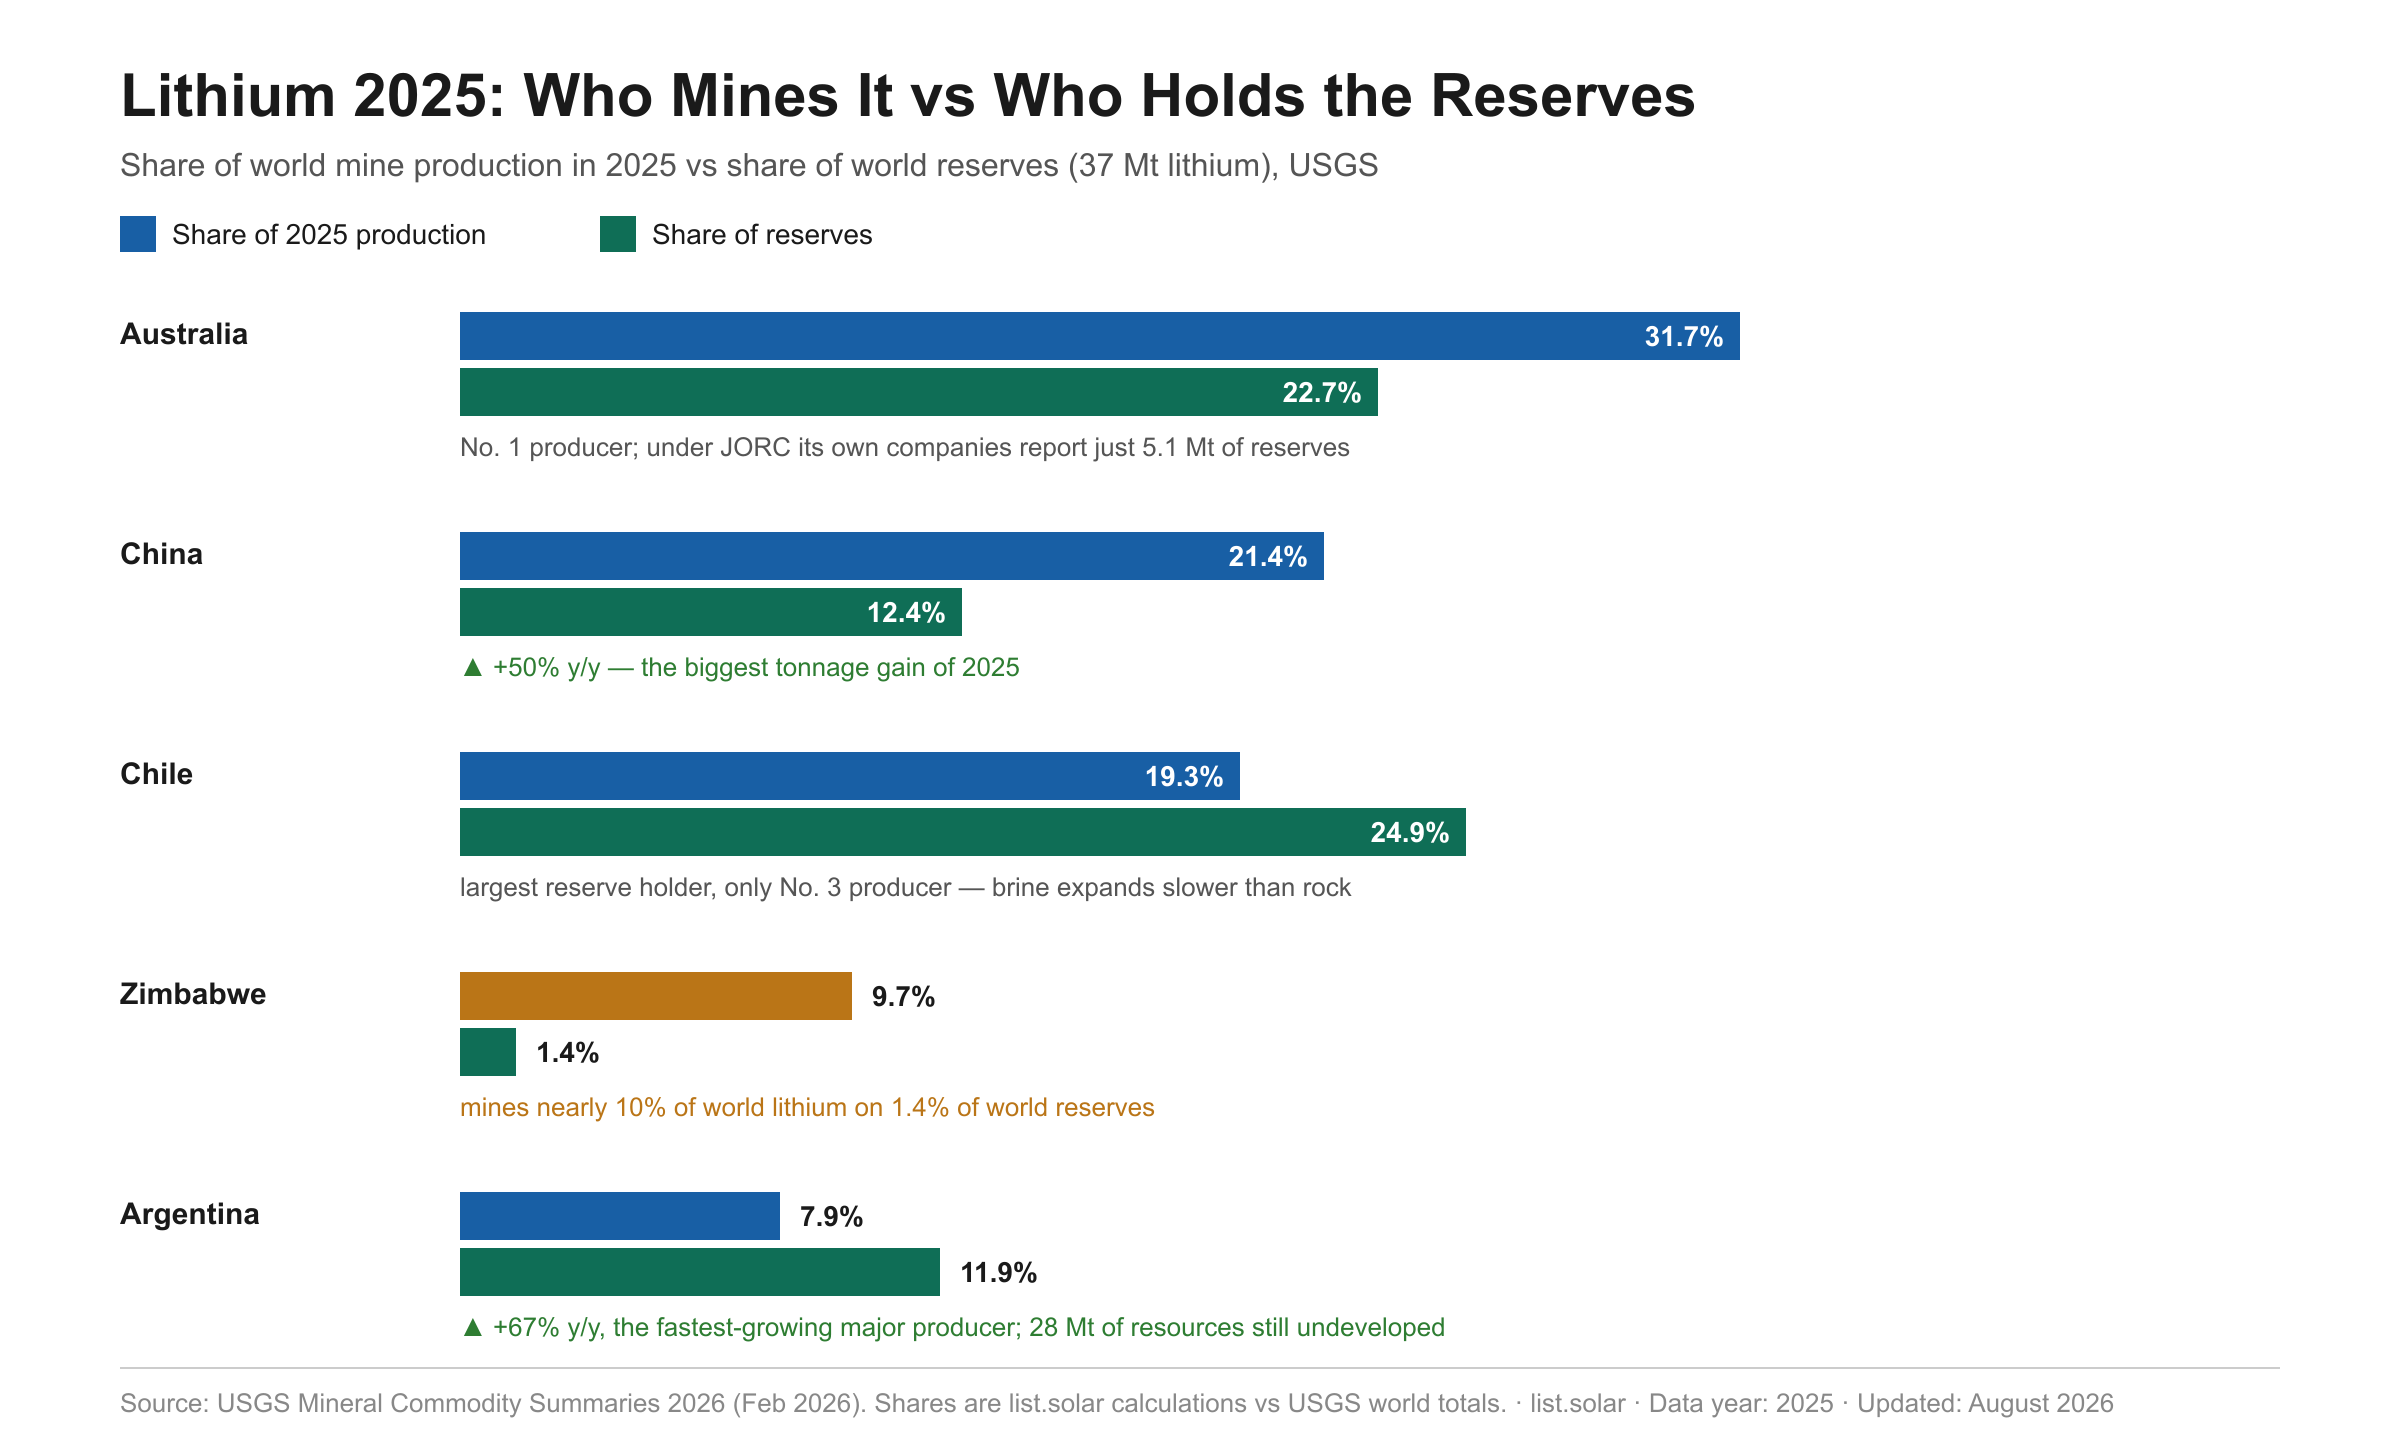
Company rankings sit on top of country geology. USGS data for 2025 shows the growth was broad — every major producer except Portugal expanded — but wildly uneven: China added the most new tonnes, Argentina grew fastest among the majors, and Mali went from a rounding error to the world's seventh producer in a single year as Goulamina ramped.
| Country | 2024, t Li | 2025, t Li | Change y/y | Share of 2025 world total |
|---|---|---|---|---|
| Australia | 82,700 | 92,000 | +11% | 31.7% |
| China | 41,400 | 62,000 | +50% | 21.4% |
| Chile | 48,900 | 56,000 | +15% | 19.3% |
| Zimbabwe | 20,000 | 28,000 | +40% | 9.7% |
| Argentina | 13,800 | 23,000 | +67% | 7.9% |
| Brazil | 10,200 | 12,000 | +18% | 4.1% |
| Mali | 770 | 9,400 | +1,120% | 3.2% |
| Canada | 4,820 | 5,600 | +16% | 1.9% |
| Portugal | 380 | 380 | 0% | 0.1% |
| United States | W | W | — | — |
| World total (rounded) | 222,000 | 290,000 | +31% | 100% |
Tonnes of lithium content (multiply by 5.32 for LCE). W = withheld by USGS to protect company data; world total excludes US production. Shares are our calculation against the USGS world total. Source: USGS Mineral Commodity Summaries 2026, February 2026.
Reserves are not resources — and the ranking changes with the word
Reserves are the tonnes that can be mined at a profit today under a reporting code; resources are the geology, profitable or not. The two are routinely conflated, and the confusion is not harmless: measured and indicated world resources stand near 150 million t of lithium, four times the 37 million t of reserves. Chile leads reserves; Argentina and Bolivia — most of whose brine has never been commercially developed — lead the resource table. Note the standards, too: USGS credits Australia with 8.4 million t of reserves, while under the stricter JORC code Australian companies themselves report 5.1 million t.
| Country | Reserves, Mt Li | Resources (M+I), Mt Li | 2025 production, t Li |
|---|---|---|---|
| Chile | 9.2 | 13 | 56,000 |
| Australia | 8.4 | 10 | 92,000 |
| China | 4.6 | 10 | 62,000 |
| Argentina | 4.4 | 28 | 23,000 |
| United States | 4.4 | 30 | W |
| Bolivia | — | 23 | — |
| Canada | 1.6 | 8.1 | 5,600 |
| Zimbabwe | 0.5 | 0.86 | 28,000 |
| World | 37 | ~150 | 290,000 |
Reserves = economically mineable now (USGS definitions; Australia under JORC: 5.1 Mt). Resources = measured and indicated, in-situ. "—" = zero or not reported. Source: USGS Mineral Commodity Summaries 2026.
Prices: a 31% crash, then an 11-month squeeze
The 2025 average masks the whiplash. The annual US contract price for battery-grade carbonate fell 31% to $9,000/t — the fourth-lowest level of the five-year series — while the Chinese spot market spent the year climbing off the floor and then, after Jianxiawo stopped, went vertical. Spodumene followed with a lag: PLS realized $599/t in the June 2025 quarter; six months later MinRes booked $1,094/t.
| Date | Marker | Level |
|---|---|---|
| 2021 → 2023 | US annual contract price, battery-grade carbonate | $11,700 → $63,700 (2022 peak) → $39,000 |
| 2024 / 2025 | Same series — the trough | $11,800 / $9,000 (−31% y/y) |
| Jan 2025 | China spot carbonate (c.i.f.) | ~$9,300/t (≈¥75,000) |
| Aug 10, 2025 | CATL's Jianxiawo suspended — permit expired | ~3% of world supply offline |
| Nov 2025 | China spot carbonate; spodumene (f.o.b. Australia) | ~$10,300/t; ~$970/t |
| May 2026 | Guangzhou futures peak | ~¥205,000/t |
| Jun 29, 2026 | Jianxiawo restart permit reissued | −10% in two sessions, to ~¥157,000 (~$23,175) |
Sources: USGS MCS 2026 (annual series and 2025 spot markers, via Benchmark Mineral Intelligence assessments); Mining.com and The Northern Miner for 2026 futures. Contract and spot series are not directly comparable.
The forward question is whether the squeeze survives the restart. Chinese consultancy CITIC Futures projects 2026 supply of about 2.11 million t LCE against demand of 2.10 million t — a surplus of just 7,000 t, essentially a balanced market after two years of glut. SQM's management expects the global market to grow roughly 25% in 2026, pulled by energy storage as much as by EVs. With inventories drawn down through the Jianxiawo outage, the margin for error on the supply side is the thinnest it has been since 2022.
Lithium is one commodity — the miners trade like many
The companies in this ranking are priced by very different markets. SQM and Albemarle trade partly as chemicals businesses; Rio Tinto's lithium unit is a rounding error inside an iron ore giant; PLS and Liontown move tick-for-tick with spodumene; Ganfeng and Tianqi carry Chinese equity-market beta on top of lithium exposure. That is why lithium equities regularly diverge from the lithium price itself — in November 2025 spodumene rose 21% in a month while several producers' shares lagged, and the reverse happened on restart headlines in June 2026. For investors who want the commodity story without picking a single balance sheet, our overview of commodity markets and instruments covers how lithium fits alongside copper, uranium and the rest of the energy-transition complex, and lithium and battery ETFs bundle the producers in this table into a single ticker.
Methodology and data sources
Country-level production, reserves, resources, end-use shares and the annual price series come from a single edition — USGS Mineral Commodity Summaries 2026 (published February 2026, covering data year 2025) — to avoid mixing revisions across editions; USGS restates history each year, and its world total excludes withheld US output. Company figures come from each company's own results: calendar-2025 reports for SQM, Albemarle, Rio Tinto, Ganfeng, Lithium Argentina and CATL-related disclosures, and Australian FY25 (July 2024–June 2025) reports for PLS, Talison/IGO, Mineral Resources and Liontown; the two periods are labeled and never summed. Shares of world supply are our own calculation against the USGS 2025 world total. LCE conversions: tonnes of lithium × 5.32; spodumene concentrate converted at roughly 7.5–8 t of SC6-equivalent per tonne of LCE, reflecting typical conversion losses — all such figures are marked "e" and rounded. Attributable JV shares follow disclosed ownership (e.g., Tianqi's effective 26% of Talison). Page updated: August 2026.
FAQ
Is Albemarle the world's largest lithium producer?
It holds the industry's broadest asset base, but the claim can no longer be verified: Albemarle stopped disclosing production tonnage. SQM, which does disclose, produced about 233,000 t LCE in 2025 — the largest reported figure of any company — and targets 260,000 t in 2026. On reported output, SQM is No. 1.
Which company produced the most lithium in 2025?
SQM, with roughly 233,000 t LCE, a company record. The largest single mine was Greenbushes in Australia at about 1.4 million t of spodumene concentrate (≈180,000 t LCE contained), but its output is split among Albemarle, Tianqi and IGO through joint ventures, so no single company books it all.
Who owns the biggest lithium mine in the world?
Greenbushes is operated by Talison Lithium. Albemarle holds 49% directly; the remaining 51% sits with Tianqi Lithium Energy Australia, itself split 51/49 between China's Tianqi and Australia's IGO. Effective interests: Albemarle 49%, Tianqi 26%, IGO 25%. Capacity is being expanded toward 2.4 million t of concentrate per year by late 2026.
Why did lithium prices double while the market was oversupplied?
Because roughly 3% of world supply vanished overnight. CATL's Jianxiawo mine (~46,000 t LCE/yr) was suspended on August 10, 2025 when its safety permit expired. Chinese futures more than doubled, peaking near ¥205,000/t in May 2026, then fell about 10% within days of the June 29, 2026 restart permit.
What is the difference between lithium reserves and resources?
Reserves are tonnes that can be mined profitably today under a reporting code (USGS, JORC, NI 43-101 — each gives different numbers). Resources describe the geology regardless of economics. World reserves are 37 million t of lithium; measured and indicated resources are about four times larger at ~150 million t (USGS, 2026).
Related on List.Solar
Sources
- USGS, Mineral Commodity Summaries 2026 — Lithium, February 2026: pubs.usgs.gov
- SQM, Q4 & full-year 2025 results and earnings call, March 2026: ir.sqm.com
- Albemarle, "Fourth Quarter and Full Year 2025 Results," February 11, 2026: albemarle.com
- Rio Tinto, Fourth Quarter 2025 Production Results, January 2026: riotinto.com
- Ganfeng Lithium 2025 annual report, March 31, 2026 (via Gasgoo): gasgoo.com
- PLS (Pilbara Minerals), FY25 results and June 2025 quarterly report, July–August 2025: pls.com
- IGO / Talison, Greenbushes FY25 production (Australian Mining), July 30, 2025: australianmining.com.au
- Mineral Resources, December 2025 quarterly report, January 29, 2026 (ASX)
- Liontown Resources, June 2025 quarterly activities report, July 29, 2025: liontown.com
- Lithium Argentina, Q4 & full-year 2025 results, March 23, 2026: lithium-argentina.com
- S&P Global Commodity Insights, "Rio Tinto to control third-largest lithium reserves," October 2024: spglobal.com
- Mining.com, "China lithium price slides on speculation over CATL mine restart," June 22, 2026: mining.com
- The Northern Miner, "China lithium price slides over CATL restart chatter," June 22, 2026: northernminer.com
Also read
- EU Innovation Fund Selects Holosolis 5-GW Solar Factory in €3.4B Round
- CHN Energy Switches On 120-MWh Battery at Rudong Solar-Hydrogen Hub
- BloombergNEF Sees $332 Billion Copper Gap as Metal Shortages Ease
- Whyalla West Tender Picks Four Bids for Nearly 13 GW of Wind and Solar
- Saft Starts Solid-State Battery Cell Production in Bordeaux