Solar Market Insight Report 2019 Q4
- The quarterly SEIA/Wood Mackenzie Power & Renewables U.S. Solar Market InsightTM report shows the major trends in the U.S. solar industry.
1. Key Figures
- In Q3 2019, the U.S. solar market installed 2.6 GWdc of solar PV, representing a 45% increase from Q3 2018 and a 25% increase from Q2 2019.
- The U.S. saw record-setting residential solar capacity added with more than 700 MW installed.
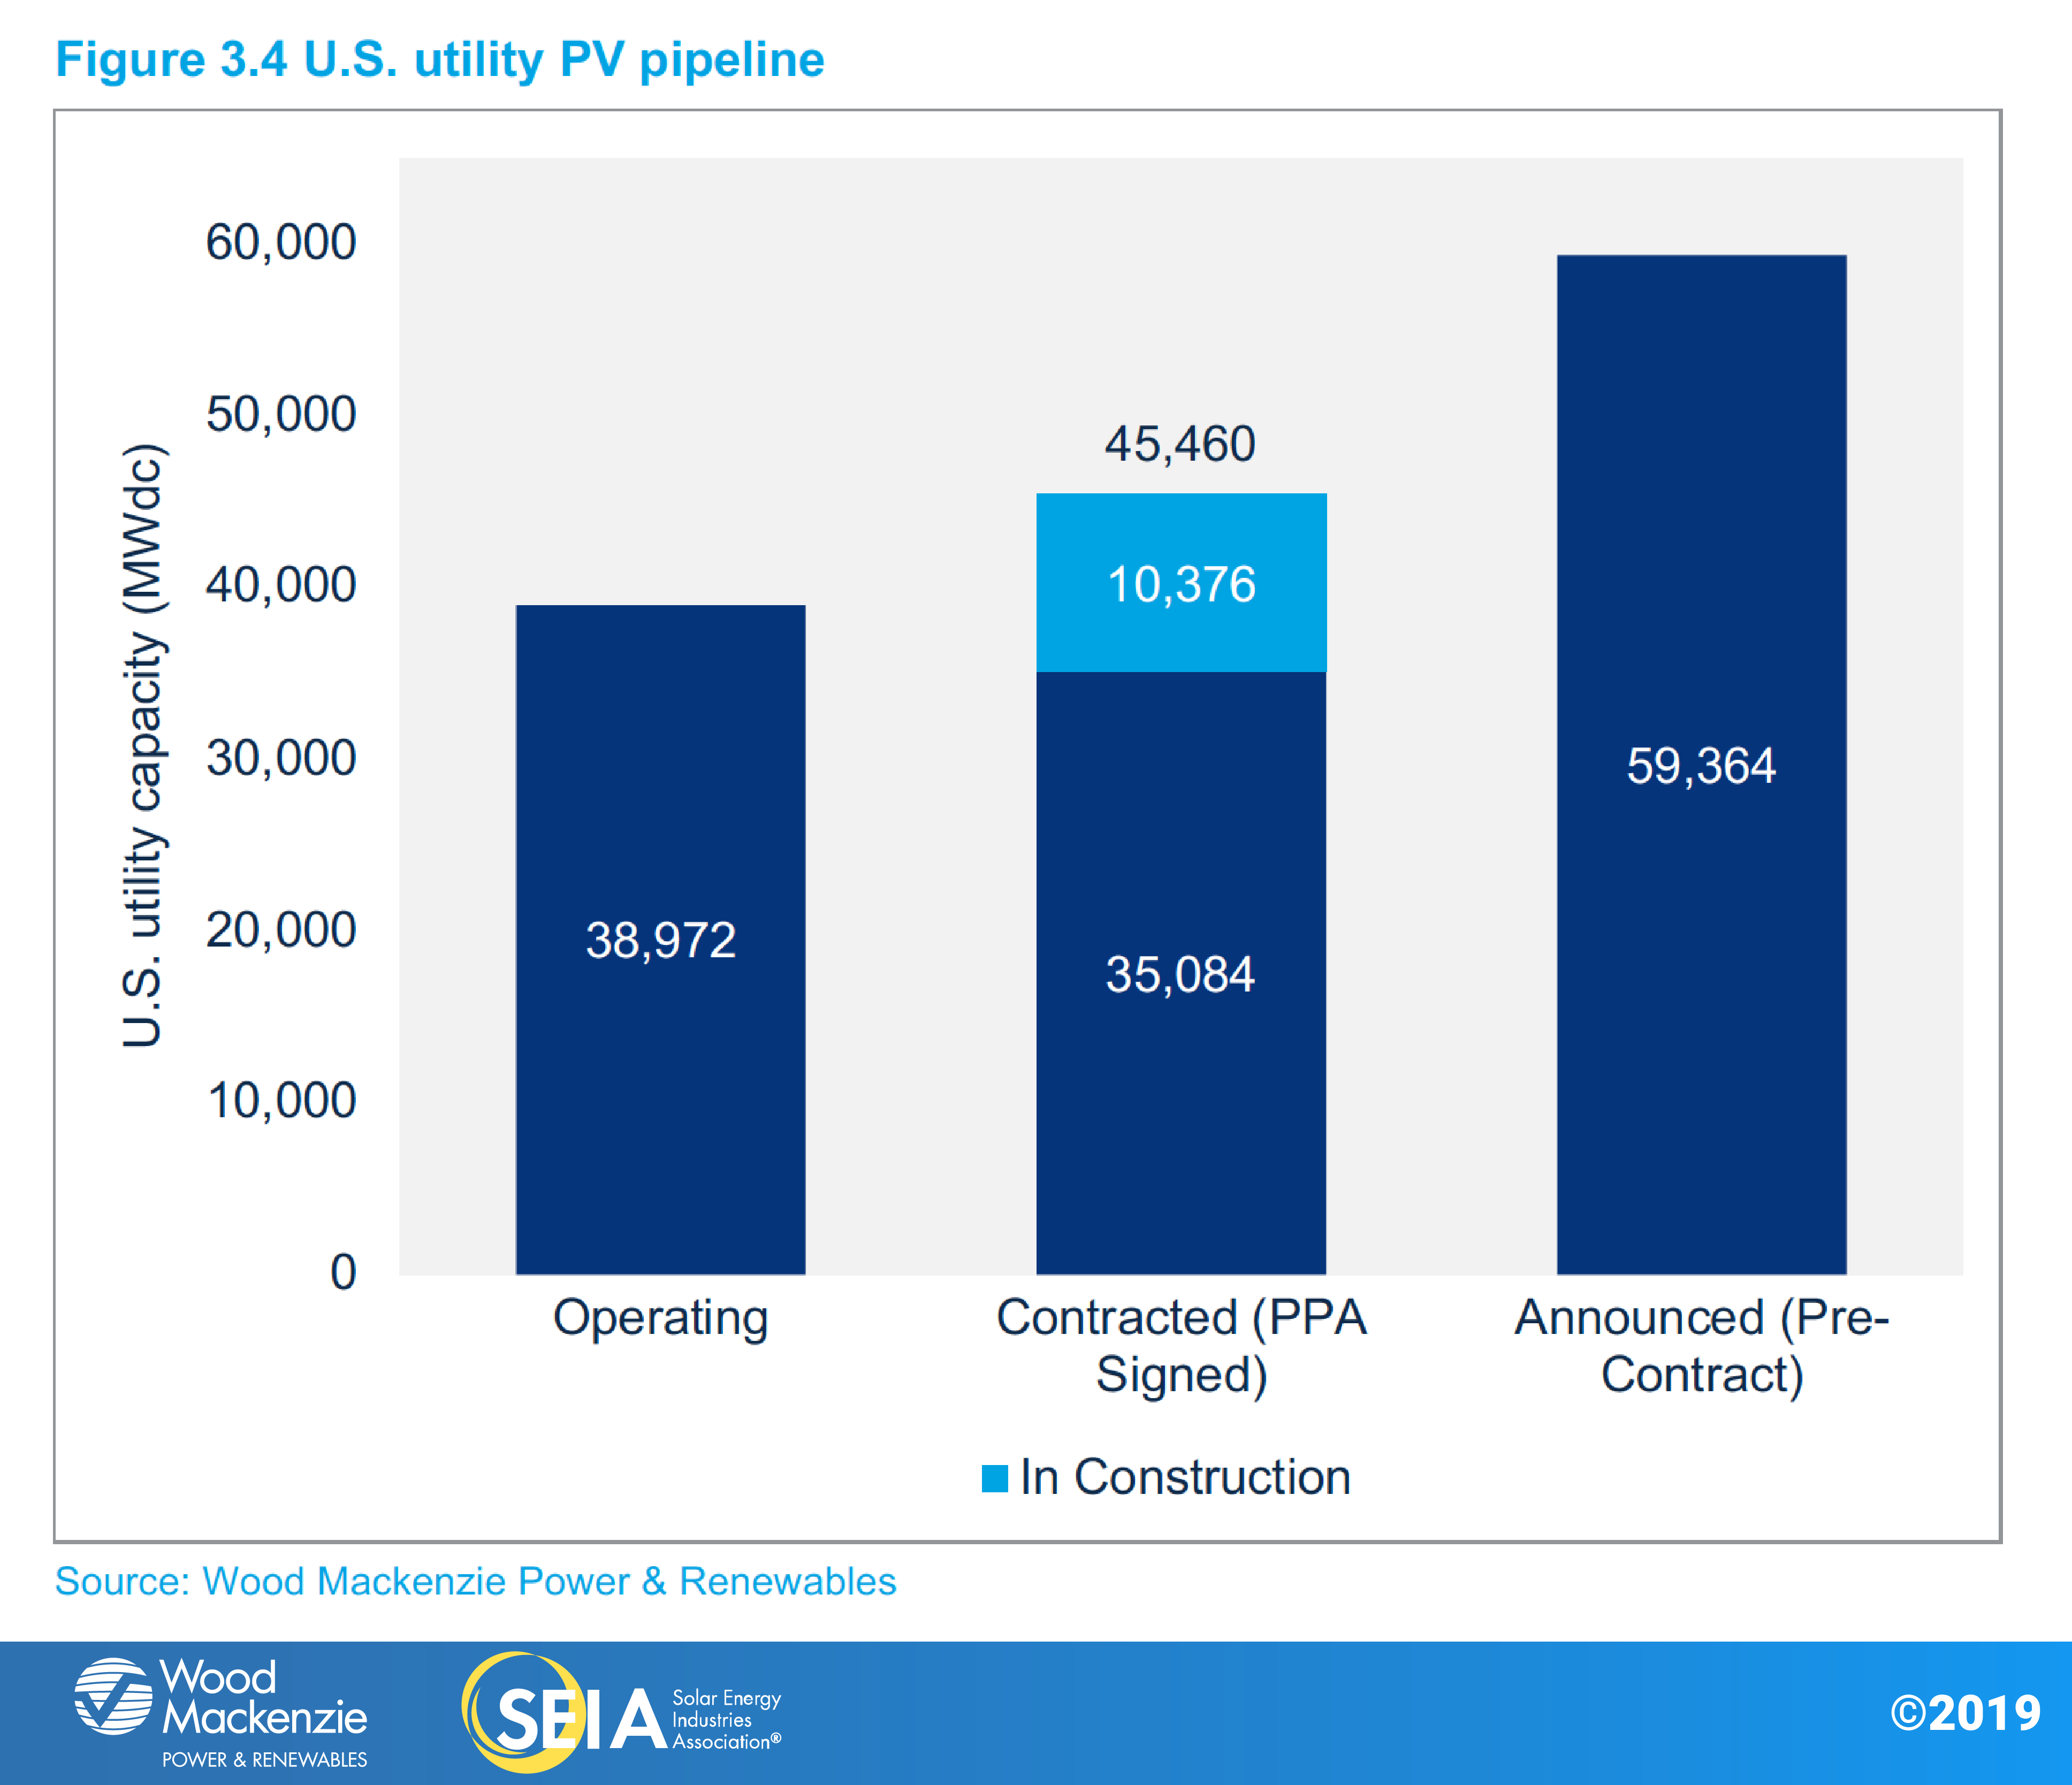
- A total of 21.3 GWdc of new utility PV projects were announced from Q1 to the end of Q3, bringing the contracted utility PV pipeline to a record high of 45.5 GWdc.
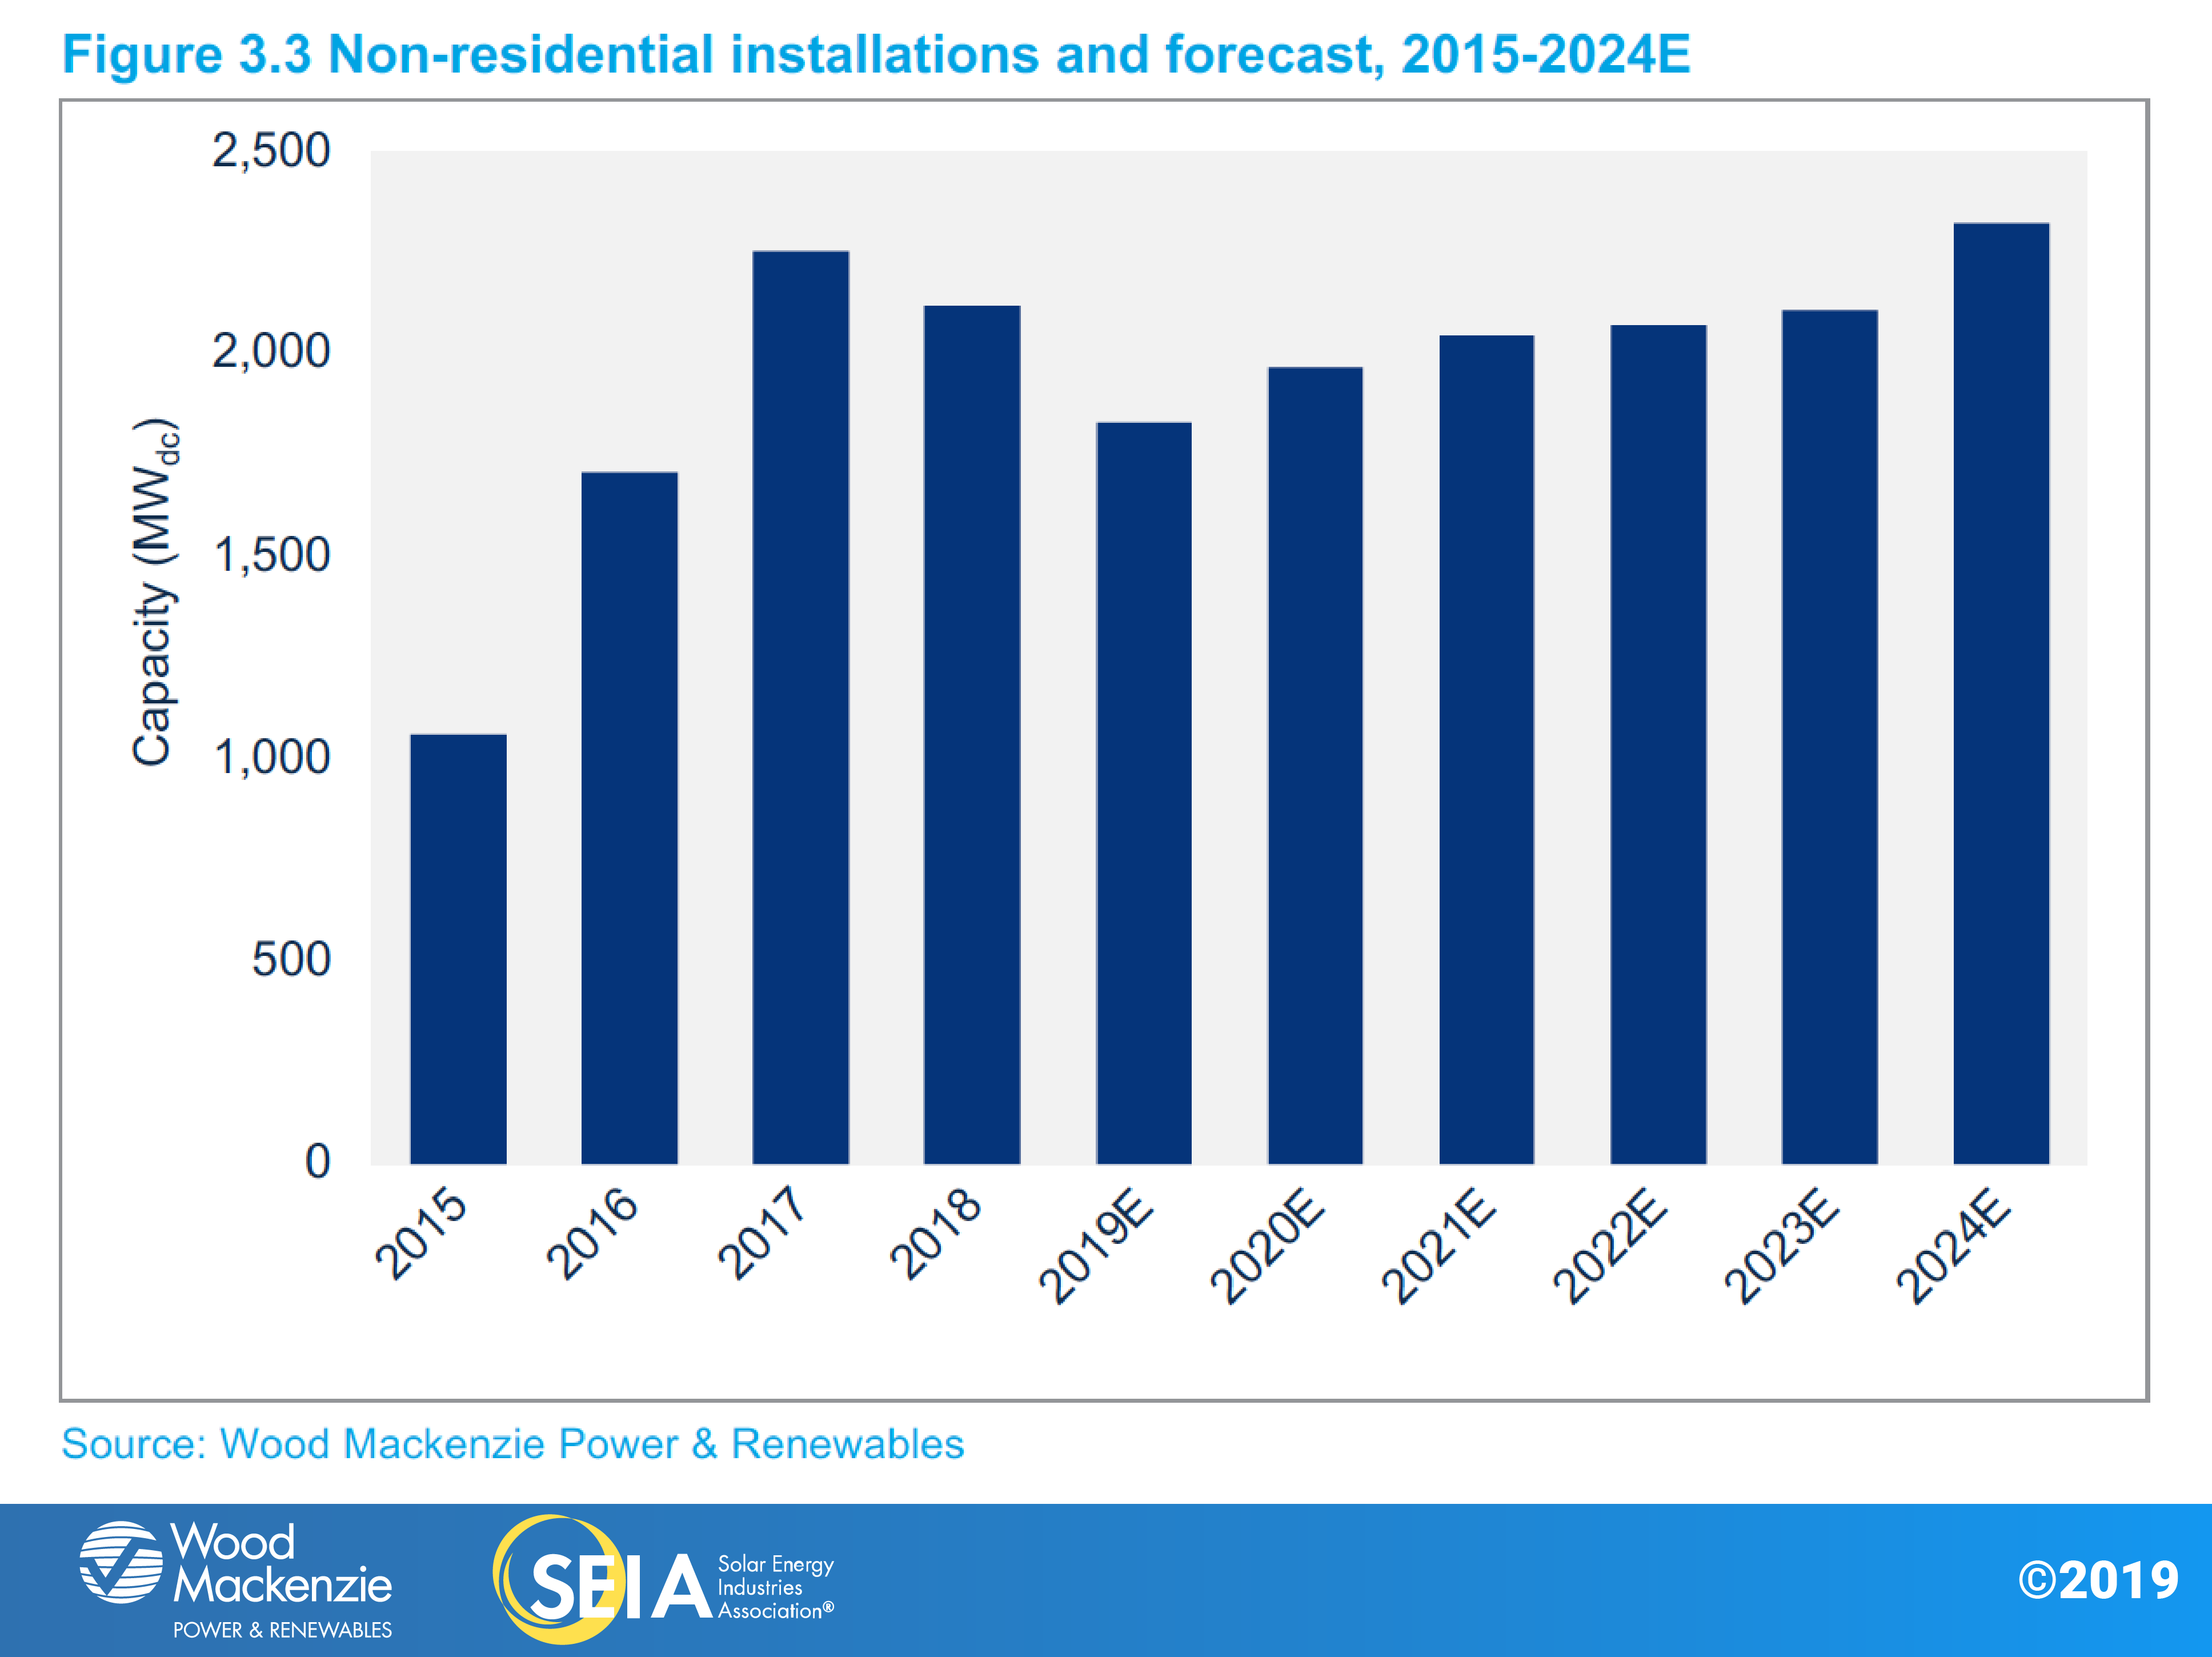
- Non-residential PV saw 445 MWdc installed as policy shifts in states including California, Massachusetts and Minnesota continue to impact growth.
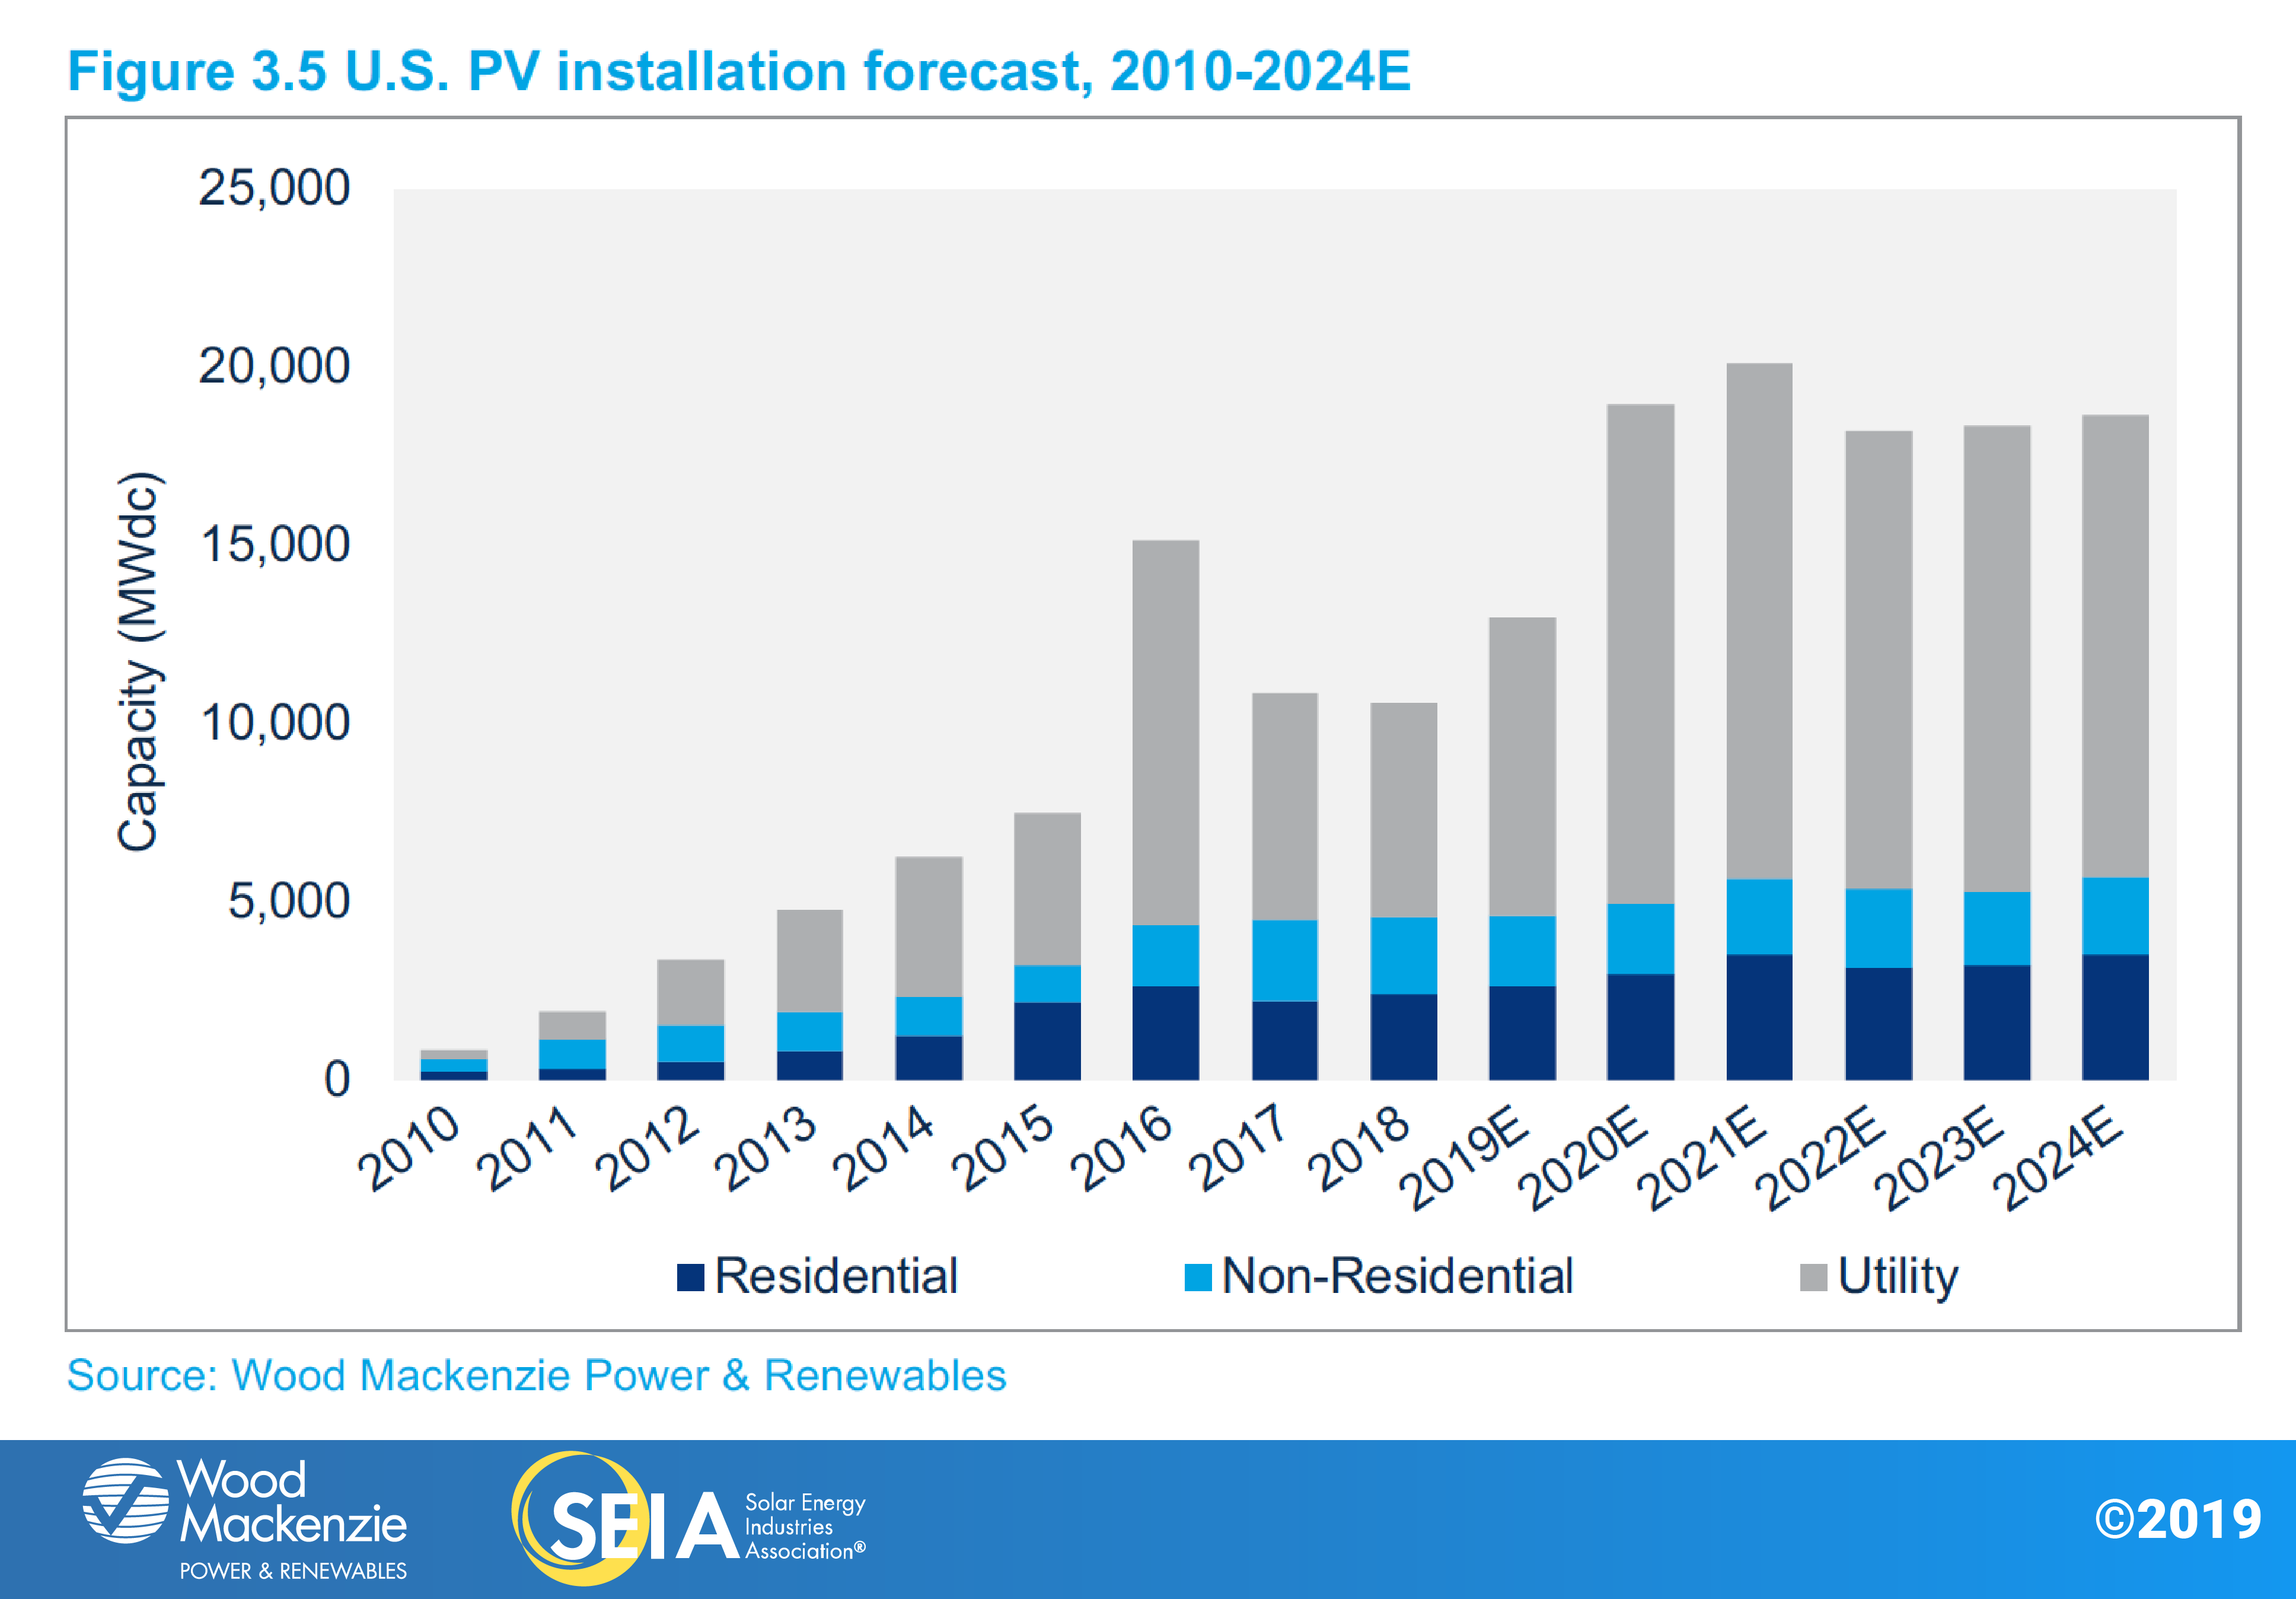
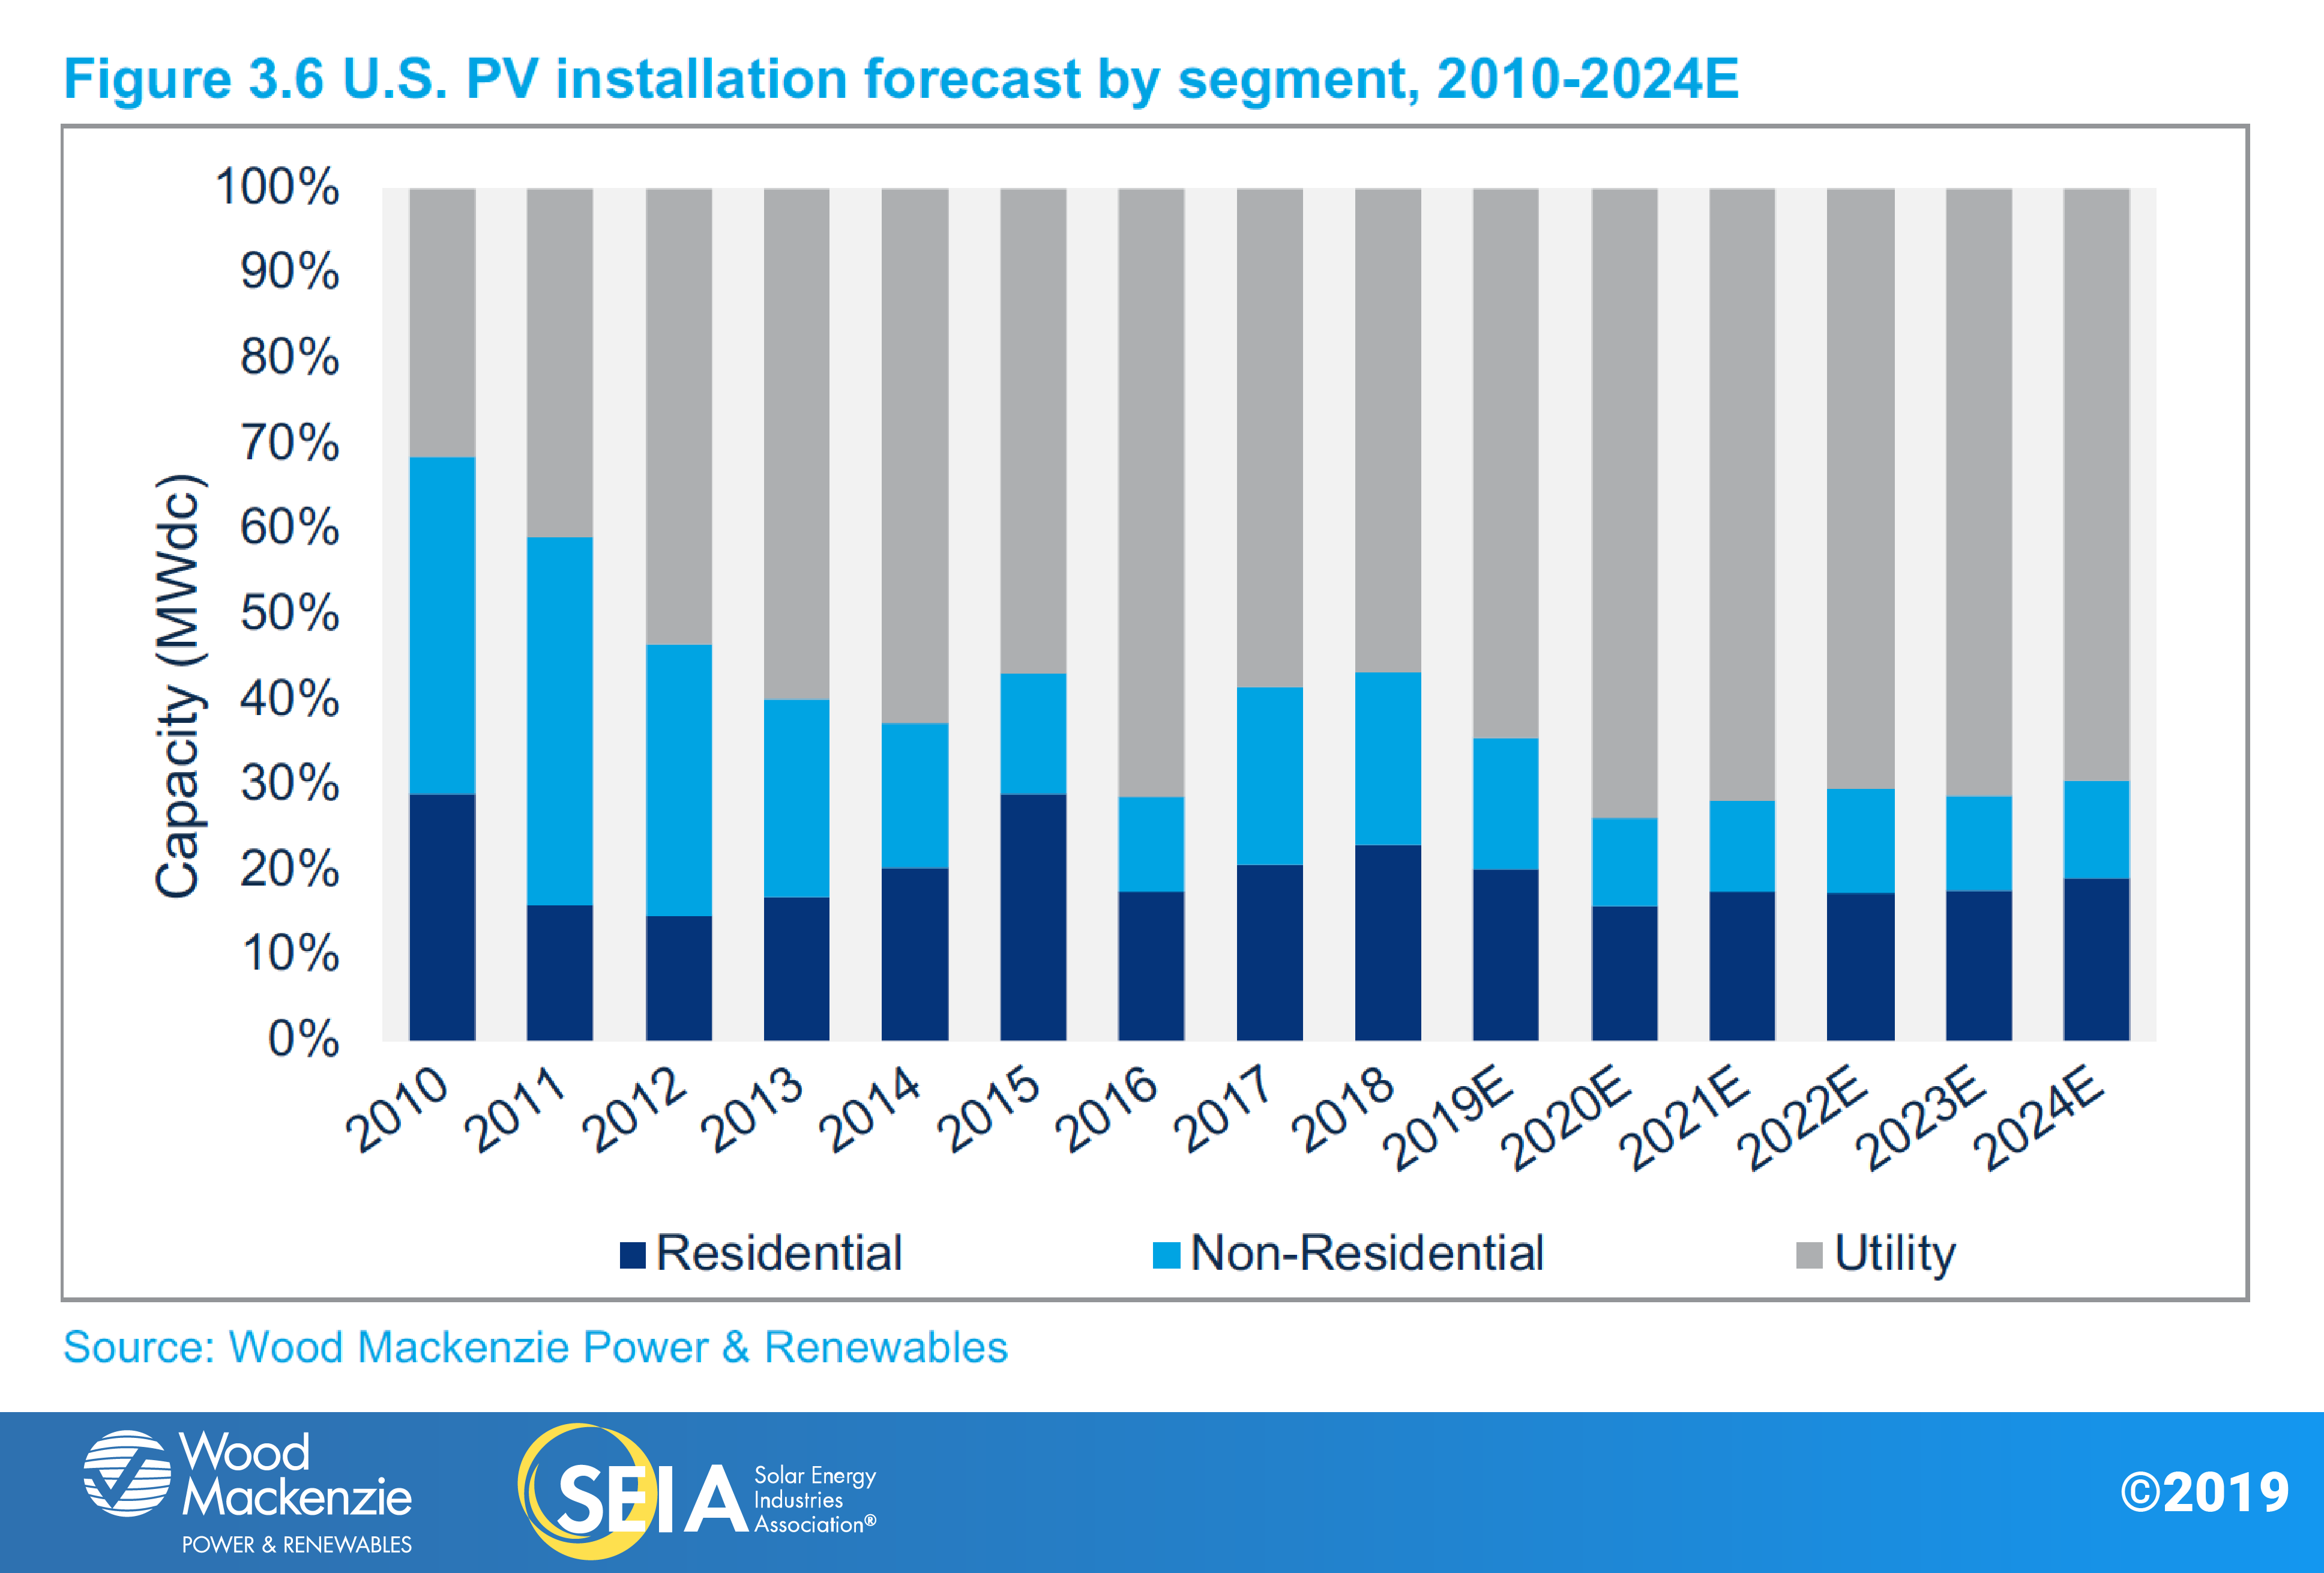
- Wood Mackenzie forecasts 23% year-over-year growth in 2019, with 13 GWdc of installations expected. In total, more than 9 GW were added to the five-year forecast since last quarter to account for new utility-scale procurement.
- Total installed U.S. PV capacity will more than double over the next five years, with annual installations reaching 20.1 GWdc in 2021 prior to the expiration of the federal Investment Tax Credit for residential systems and a drop in the commercial credit to 10% (under the current version of the law).
2. Introduction
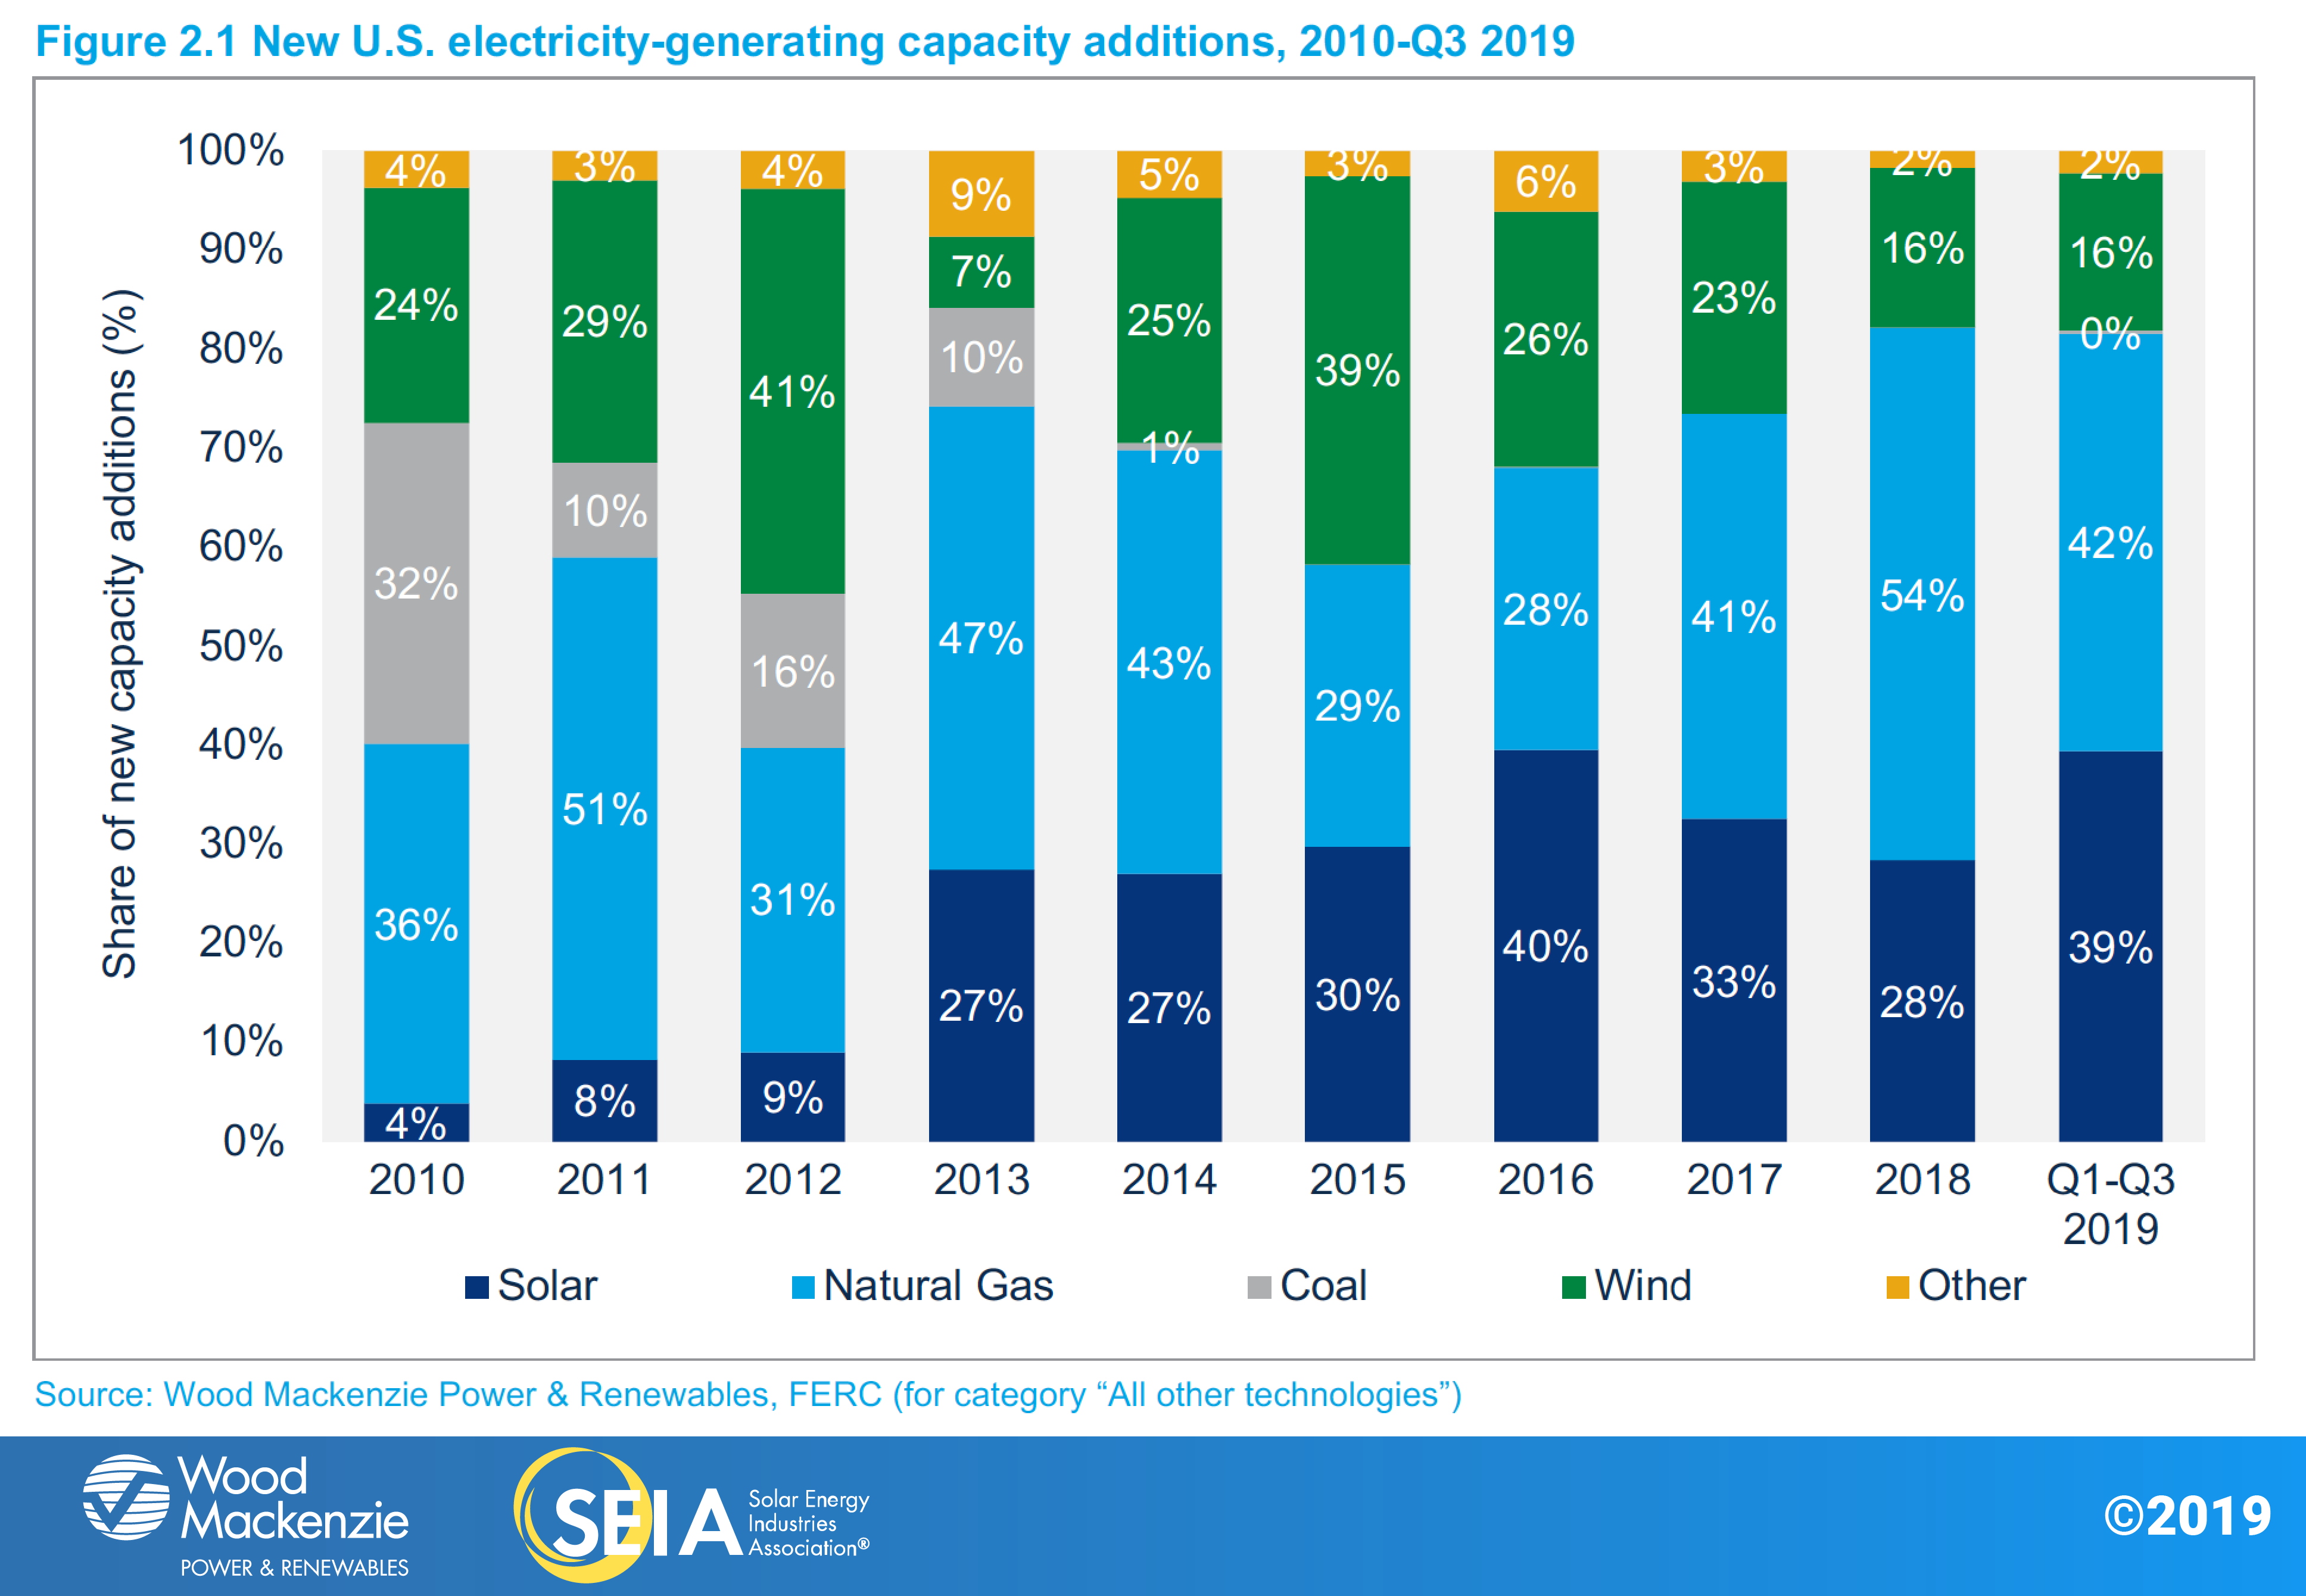
In Q3 2019, the U.S. solar market installed 2.6 gigawatts (GWdc) of solar photovoltaic (PV) capacity, a 45% increase year-over-year. The residential solar rebound continues to gain steam with the market growing 10% quarter-over-quarter and 18% year-over-year – the second consecutive quarter in which the residential segment grew across both metrics. Conversely, non-residential PV was flat on a quarterly basis and continues to see pipelines diminish due to policy transitions and persistent interconnection issues in key commercial markets. More than 1.4 GWdc of utility-scale installations came online this quarter with new project procurement growing the contracted pipeline to 45.5 GWdc. Across all market segments, solar PV accounted for 39% of all new electricity-generating capacity additions in 2019 through Q3.
Don’t call it a comeback: California drives the largest quarter ever for rooftop PV
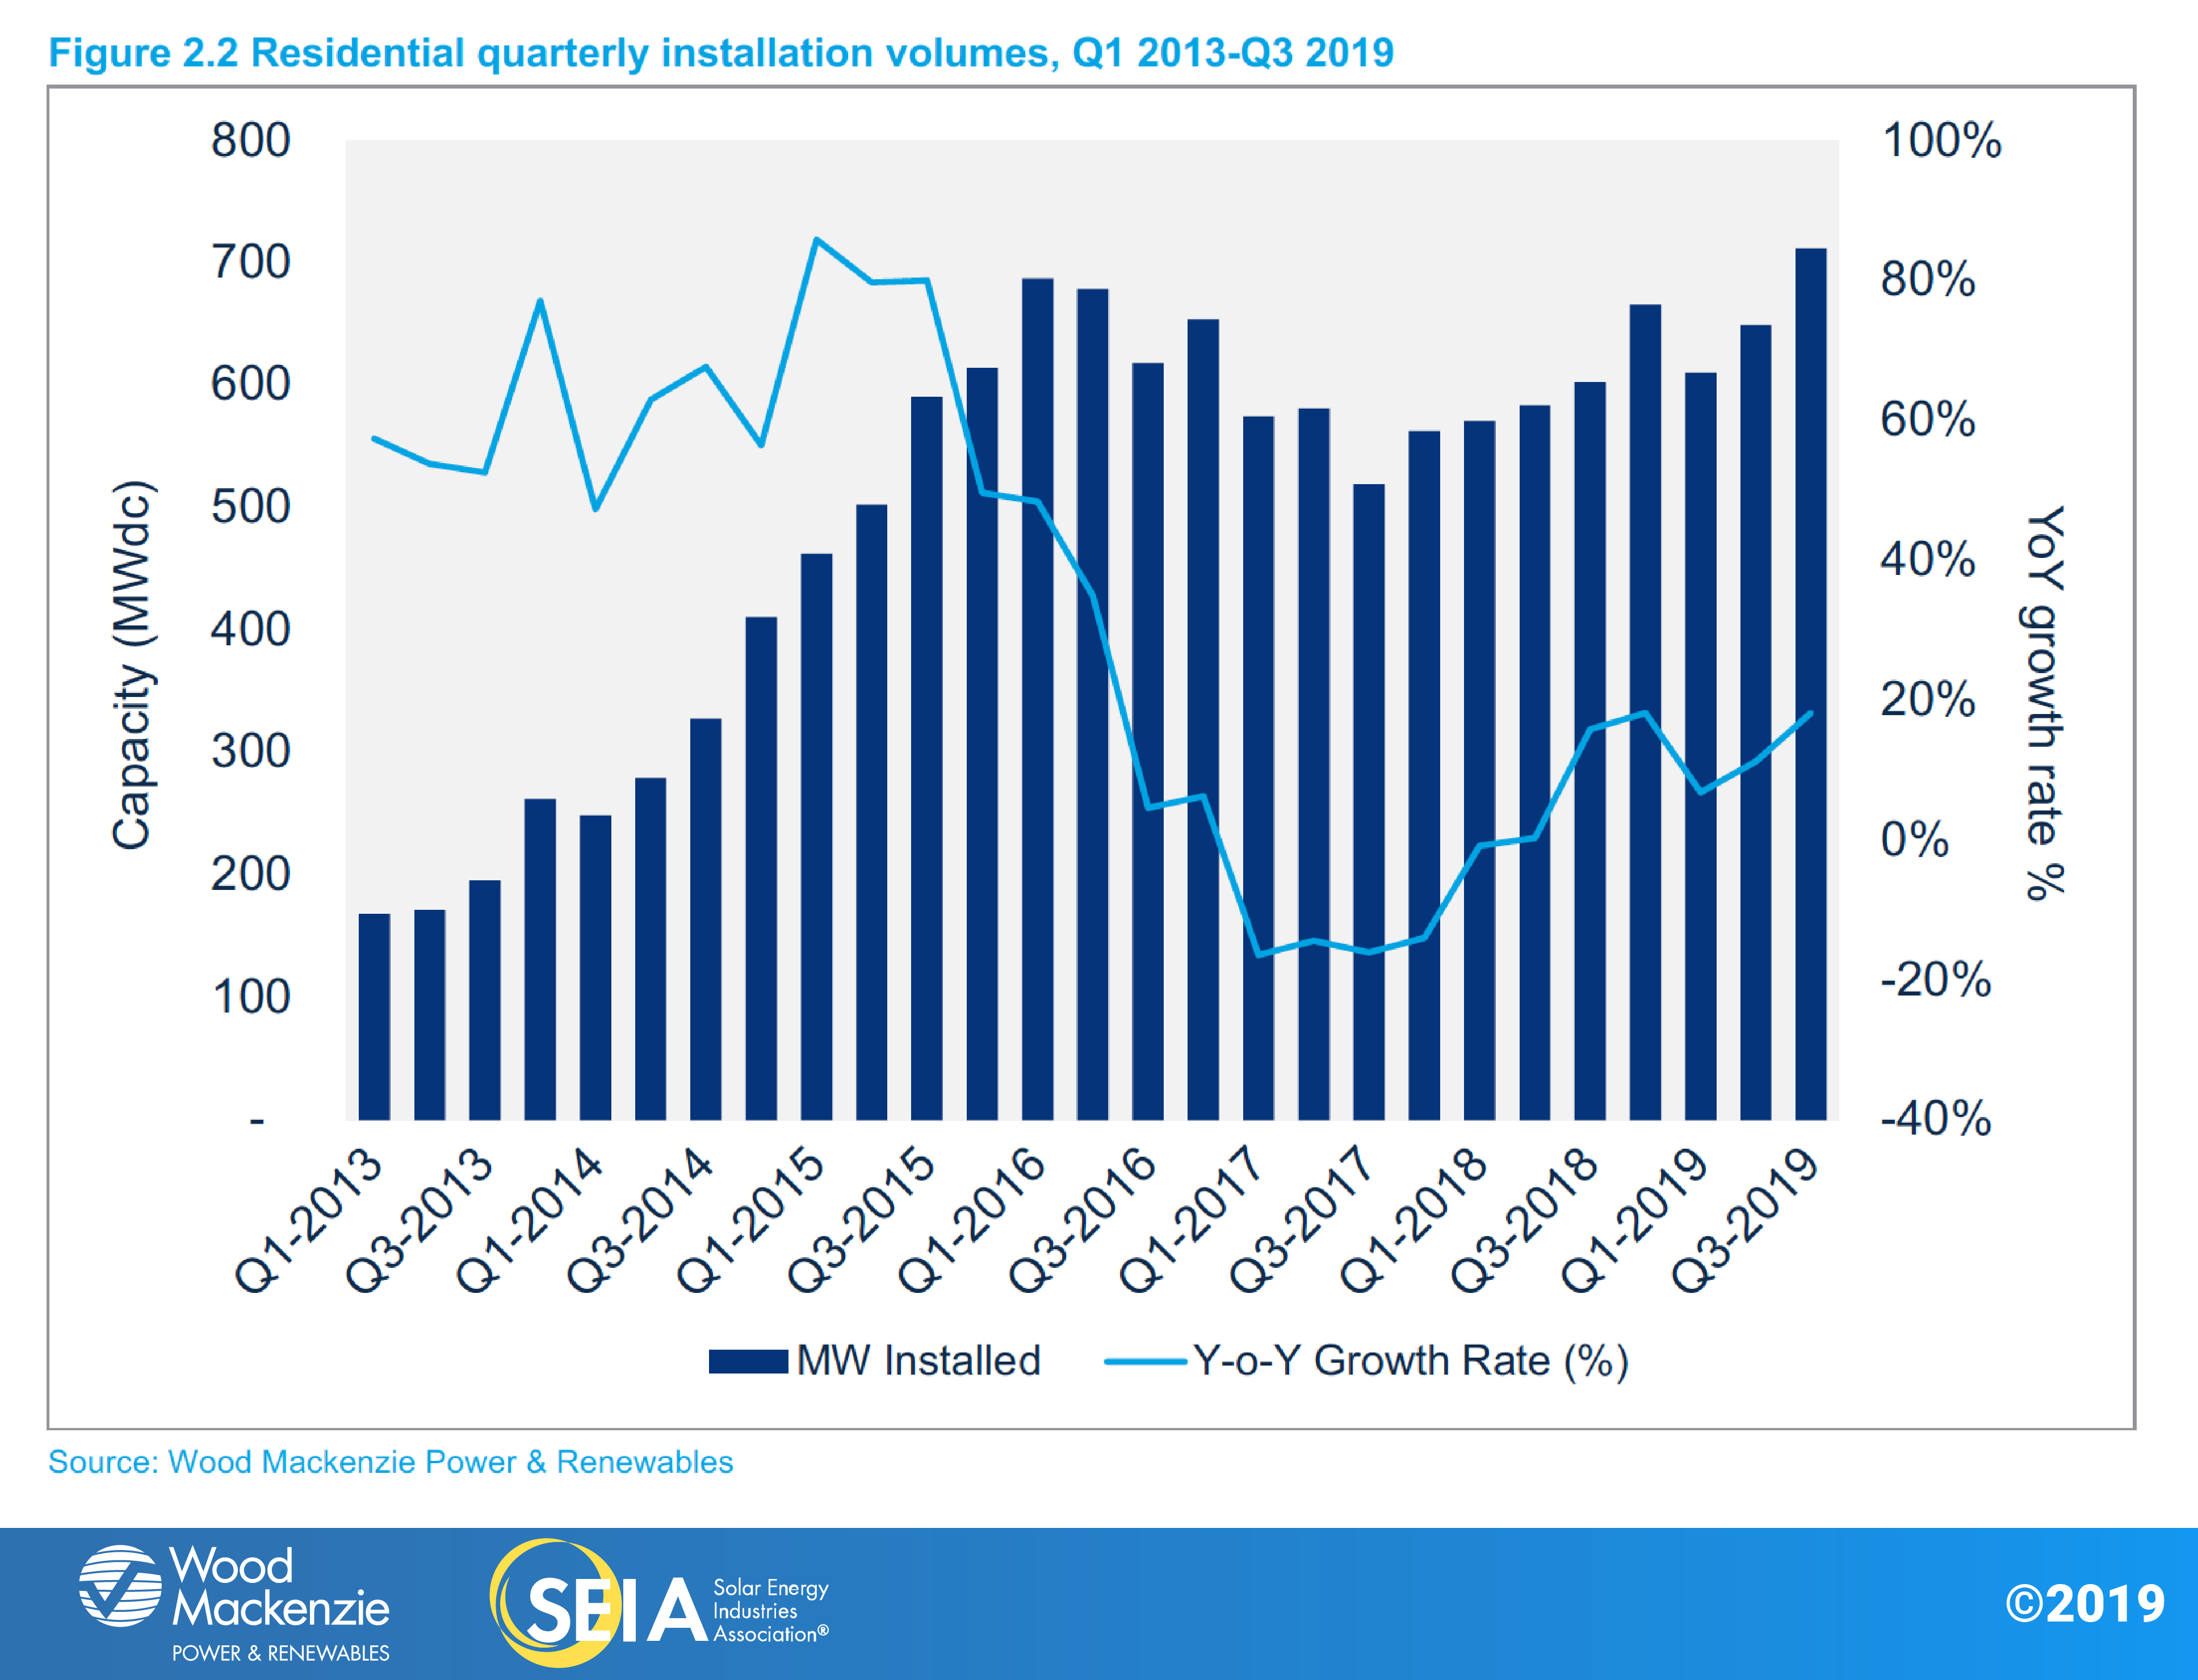
After years of steady double-digit-percentage growth over the first half of this decade, the U.S. residential sector experienced growing pains from 2016-2017 as national installers pulled back across critical geographies in California and the Northeast. But while the market has regained steam since, the sector had yet to surpass its quarterly installed capacity peak of 687 MWdc set in Q1 2016. That all changed in Q3 2019 when the market installed more than 700 MWdc of residential capacity.
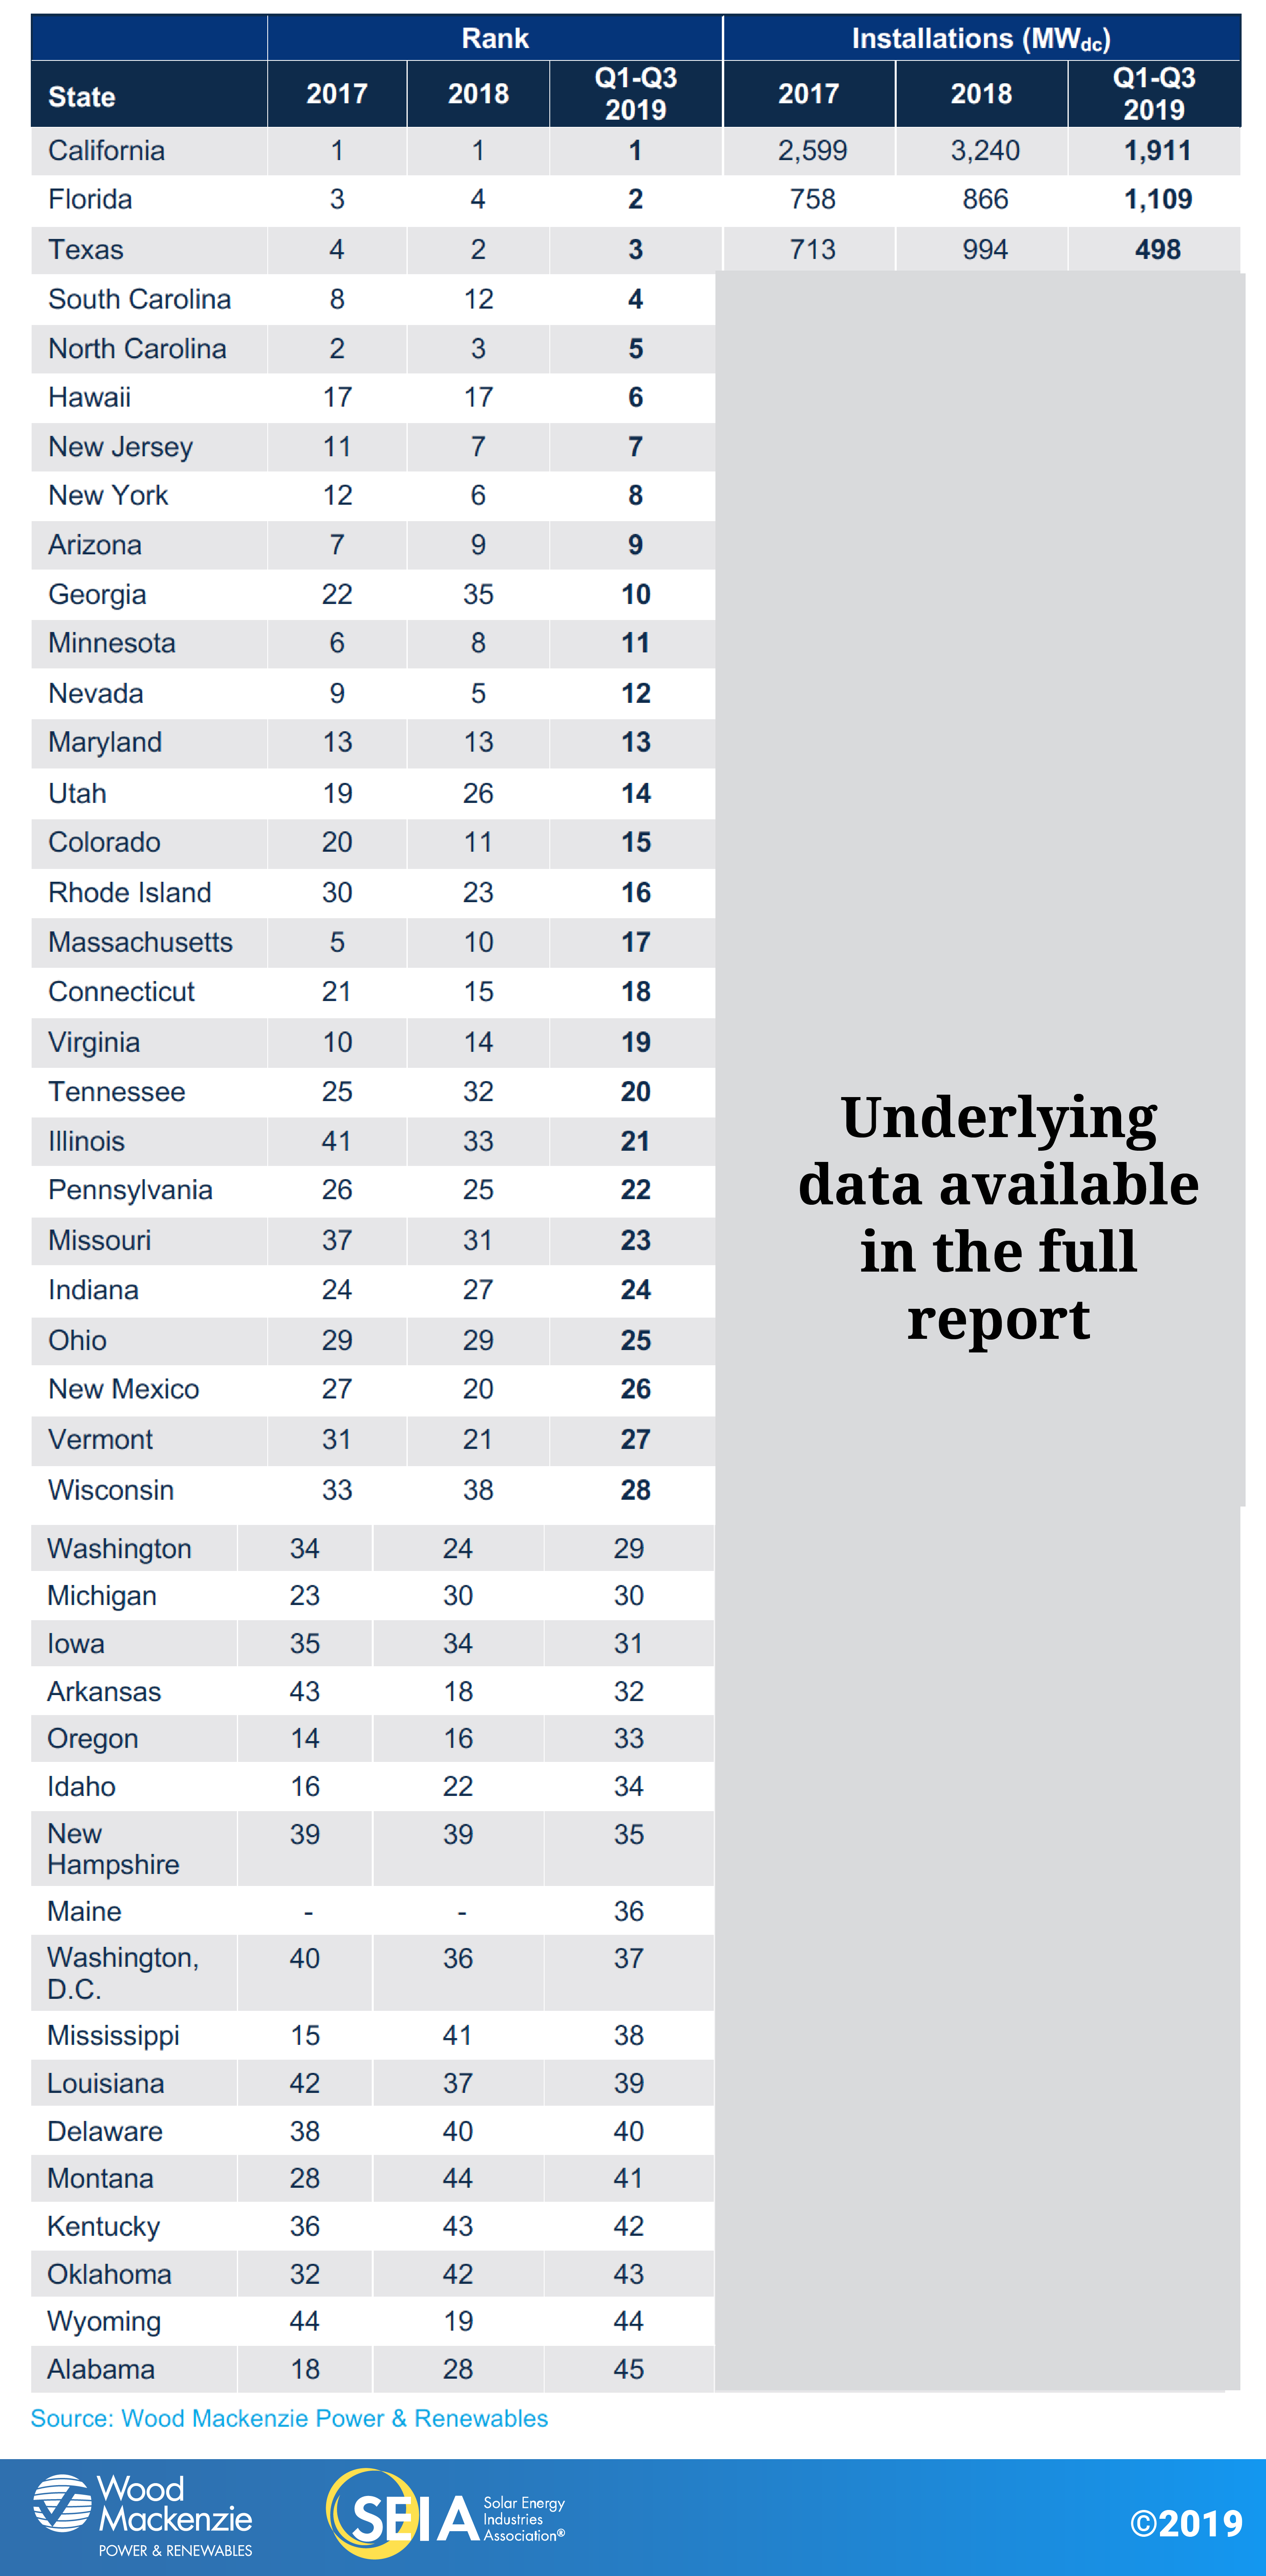
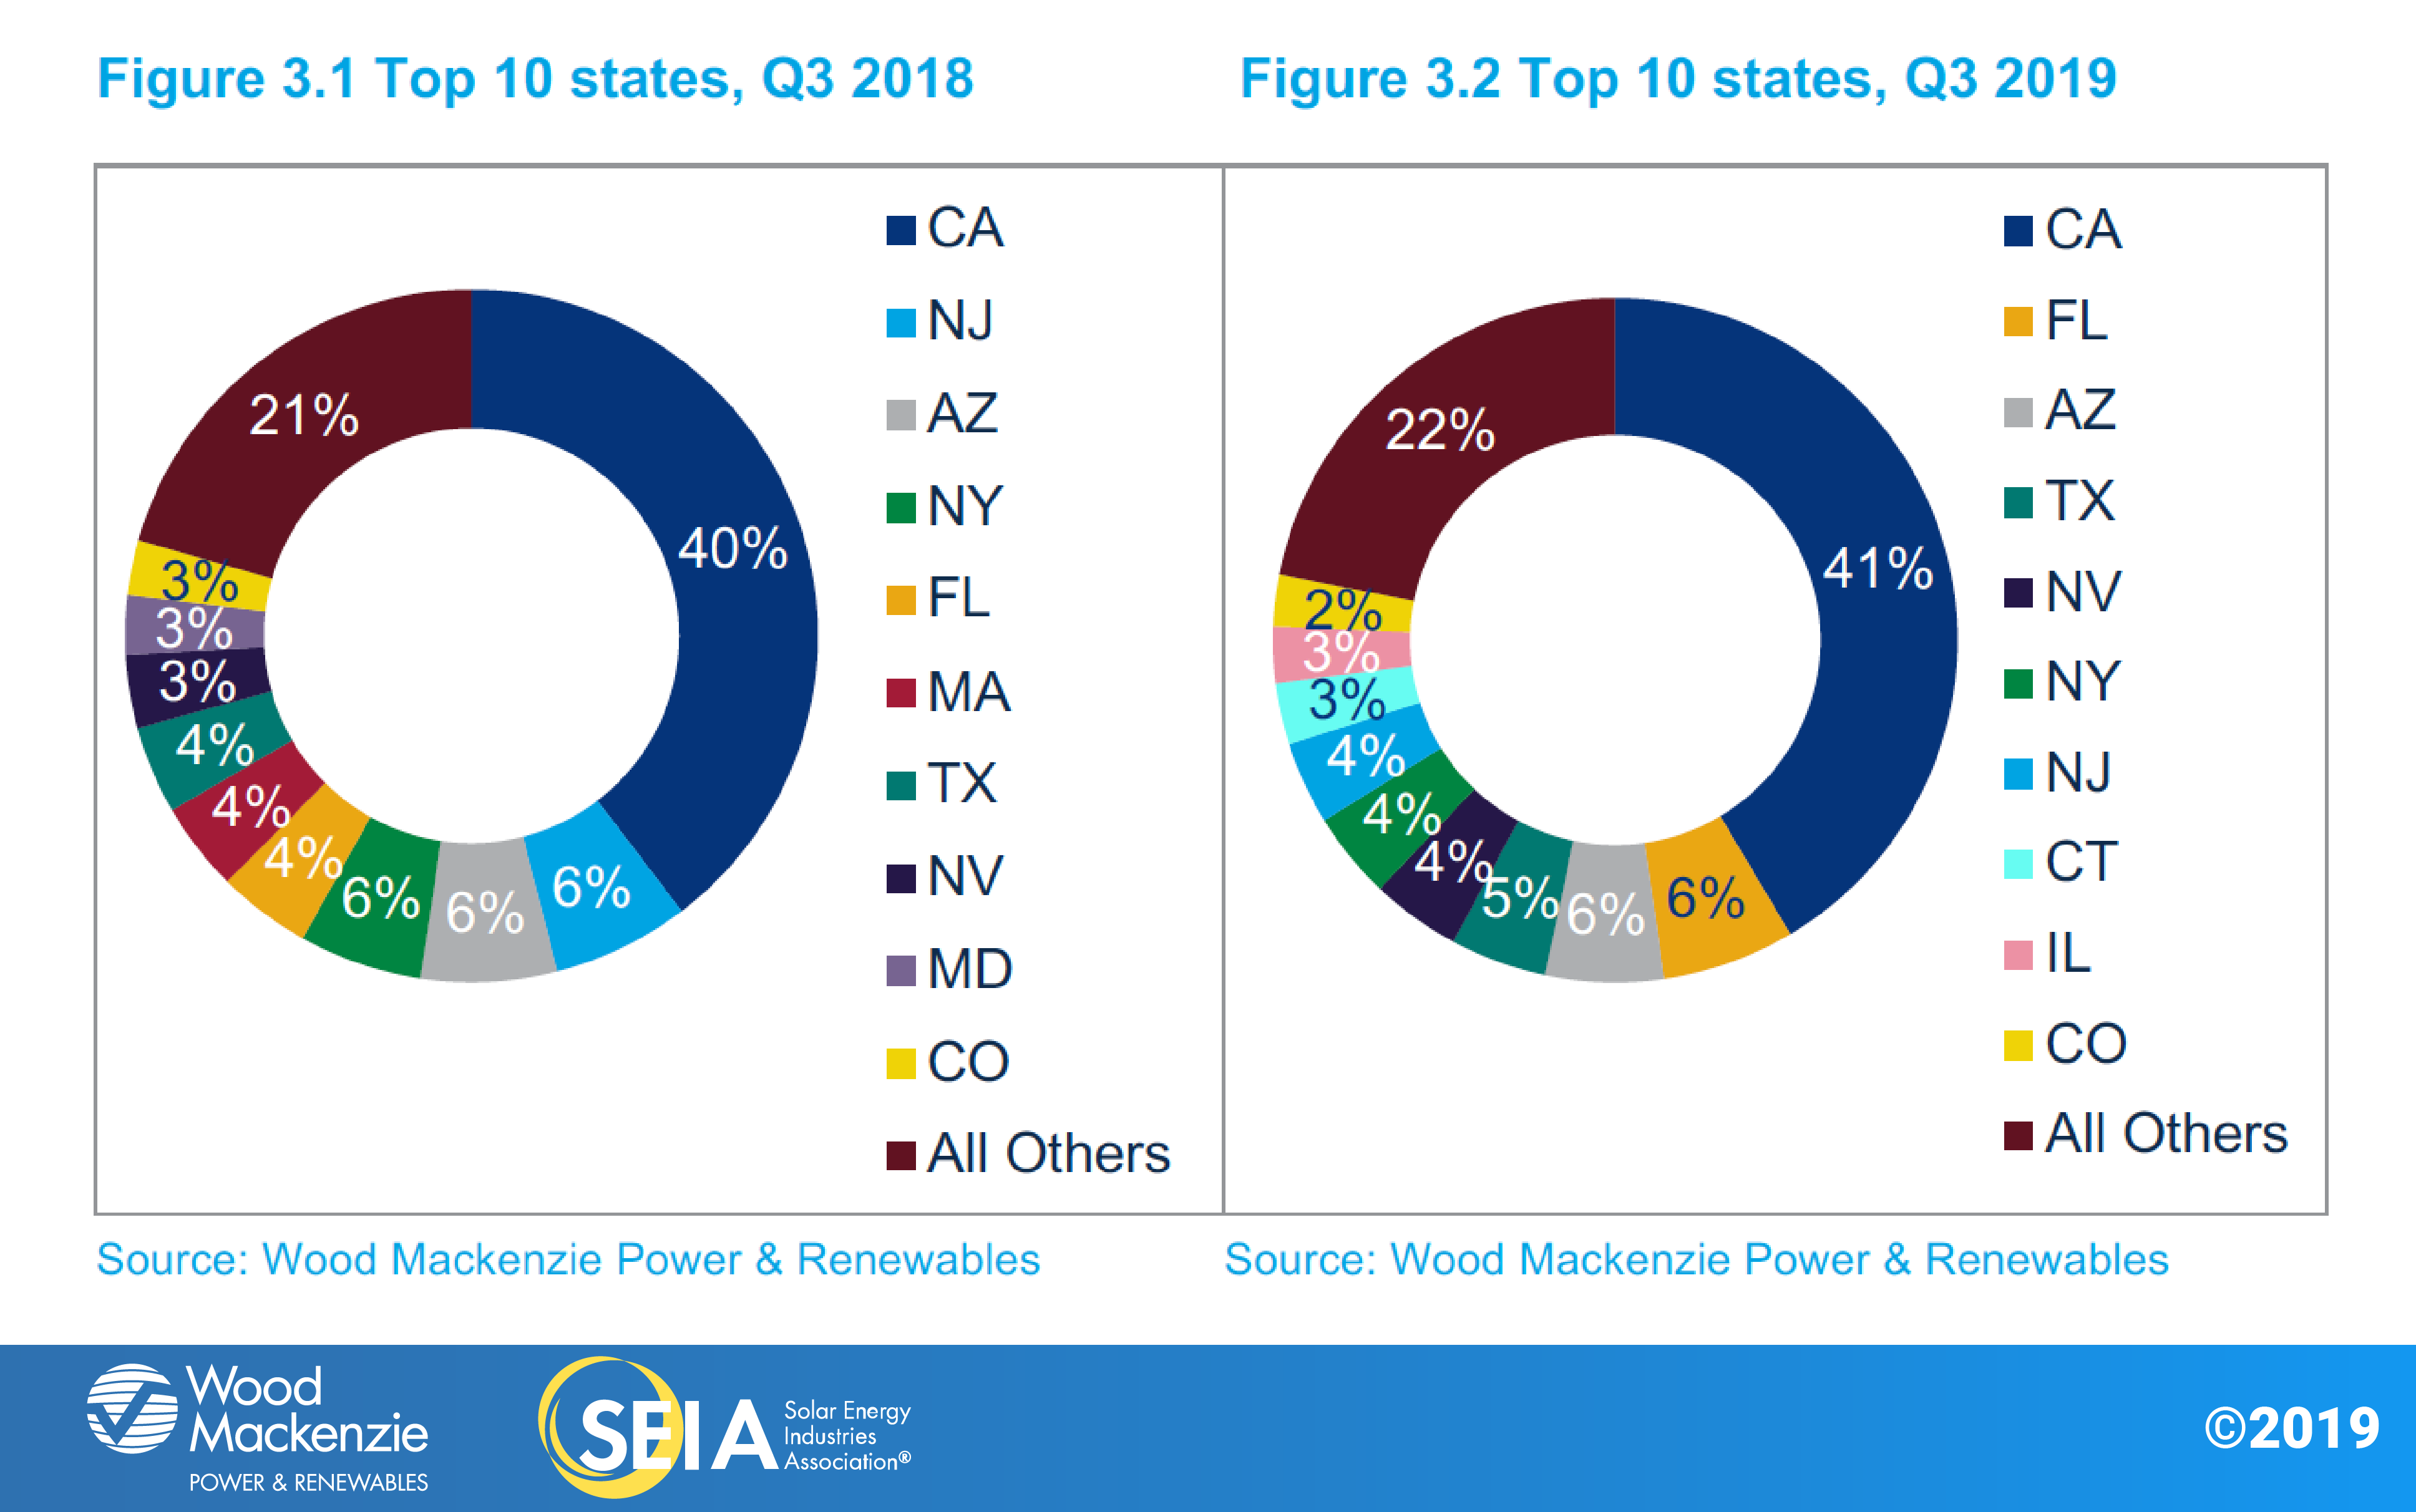
That said, there are layers of nuance in both where this growth is coming from and what is driving it. From a geographic perspective, California continues to be the largest residential market, installing nearly 300 MW in Q3 2019 and thus breaking its quarterly record. But as prices have come down, growth has spread to a broader swath of states. Outside of California, 14 additional states had record quarters, ranging from top 10 markets like Florida and Texas to smaller markets in Idaho and New Mexico. These emerging markets have begun to supplement steady installation volumes in the Northeast, a region that historically has accounted for nearly as much residential solar as California.
While California has always led the country in solar deployment, the drivers behind that growth have shifted to focus on two tracks. The first is new-build home solar demand beginning to ramp up in anticipation of the state mandate that takes effect in 2020. The second – and more unexpected – driver is increased consumer interest in solar and solar-plus-storage options in response to dissatisfaction with California utilities. This disaffection has a long history but most recently stems from Public Safety Power Shutoffs (PSPS) which have left hundreds of thousands of utility customers without electricity, often for days at a time. These developments have combined to renew a latent demand in solar and resiliency options in California, while national coverage of the issues has increased interest in solar paired with storage outside the state.
Non-residential PV enters a second consecutive year of annual decline
Unlike in the residential market, a handful of state-specific regulatory cliffs and policy reforms that took effect in 2018 continued to impact non-residential installations through Q3 2019. Major policy reforms continued to hamper development in the core non-residential markets of California, Massachusetts and Minnesota. In the case of California, installations were flat quarter-over-quarter but down year-over-year, suggesting that installation declines stemming from the transition to new time-of-use rates are real but abating. In Massachusetts, non-residential deployment numbers continue to be impacted by interconnection delays and the ongoing National Grid cluster study, despite a pipeline of mechanically complete projects that are sitting idle. Accordingly, the Bay State had its lowest quarter of non-residential PV interconnected since 2011.
Positive policy developments in New York, Maryland, Maine and New Jersey over the first half of 2019 will boost the non-residential space from 2020-2022 before it declines in 2023 in response to the step-down of the solar Investment Tax Credit under current federal law.
New utility procurement breaks records while 100% renewables targets and offsite corporate demand boost long-term outlook
Utility PV maintained the largest share of installed capacity in the U.S. solar market this quarter. A total of 1.4 GWdc of utility PV capacity came online in Q3 2019, representing 55% of quarterly capacity additions. Wood Mackenzie projects an additional 4.6 GWdc of utility PV capacity additions in Q4, bringing the total for 2019 to more than 8 GWdc.
A total of 10.4 GWdc of projects are currently under construction, a record high for U.S. utility-scale solar. Additionally, 8.1 GWdc of new projects were announced in Q3 2019. With 21.3 GWdc of new projects announced through the end of Q3 2019, the contracted pipeline has now reached 45.5 GWdc, the highest it has ever been in the history of U.S. utility-scale solar. The massive growth of new projects continues to be spurred by utilities and developers looking to safe-harbor enough equipment for as much capacity as possible under the 30% ITC. Notably, 5.4 GWdc of projects have been announced in Texas. While most projects have utility or corporate offtakers, a growing portion of them are being built as merchant projects to sell power directly into the ERCOT market.
Overall demand for utility PV will remain robust through 2024 even after the current surge in procurement subsides. Utilities such as Tennessee Valley Authority, PacifiCorp, Duke Energy and Idaho Power have all released updated integrated resource plans that outline increasingly ambitious utility-scale solar procurement targets for dates both before and after the ITC step-down. Additionally, the number of new and repeat corporate offtakers continues to rise, with 4.8 GWdc of new offsite C&I projects announced so far in 2019.
Voluntary procurement of utility PV based on cost-competitiveness continues to be the primary driver of projects announced in 2019, accounting for 51% of the total. This procurement has been driven by the low cost of utility PV, with recently signed PPA prices ranging from $18 to $35/MWh.
3. Market Segment Outlooks
3.1 Residential PV
Key Figures
- 712 MWdc installed in Q3 2019
- Up 18% from Q3 2018
- Up 10% from Q2 2019
Q3 2019 was significant for residential solar for several reasons. Beyond being the largest quarter in history in terms of installations, Q3 also saw a shake-up at the top of the residential solar rankings. This was the first quarter in which a Northeast state – historically a regional leader in residential PV – did not rank among the top five state markets. Instead, the top five state markets are a mixture of mature and emerging markets, with solid installation totals coming from legacy markets California and Arizona but also from newcomers Florida (No. 2), Texas (No. 4), and Nevada (No. 5).
But while these markets are home to increasingly attractive project economics, geographic diversification has been made possible in part by a slowdown in Northeast markets. Here, higher levels of saturation and the resulting steep customer-acquisition costs have slowed installation volumes since peak installation years, as the market grows past early-adopter consumers. These higher soft costs remain a long-term risk to the national market over the next few years, especially if the solar Investment Tax Credit steps down as scheduled under current law and so long as cost continues to be the foremost criterion in the choice to adopt solar.
Based on what we’ve seen in California, going forward, residential solar adoption may be driven by other factors such as resiliency and concerns about climate change. In California, the combination of new-build home solar adoption (beginning to gain steam in 2019, but legally required for most single-family homes starting in 2020) and increasing disaffection with utilities due to public safety power shutoffs (PSPS) is beginning to drive solar installations, increasingly paired with storage. While these drivers are currently specific to California, national press coverage of PSPS and wildfires in the state have the potential to resonate with homeowners across the country, creating demand for solar-based resiliency options outside the Golden State.
From 2019-2021, residential growth will range from 8% to 18% due to both emerging markets with strong resource fundamentals like Florida and Texas and markets where recent policy developments have increased our near-term forecasts. Maryland’s recent renewable portfolio standard increase, the removal of South Carolina’s net metering cap, and new incentive programs such as Illinois’ Adjustable Block Program will provide upside and growth to our residential forecasts over the next few years.
In the long term, the ITC step-down is expected to pull in demand in both legacy and emerging markets before expiring in 2022 for customer-owned systems. Modest growth resumes in 2023 and continues into 2024 based on economic fundamentals as the market adjusts to less attractive post-ITC market conditions. Long-term growth in a post-ITC world will be contingent on geographic diversification outside of legacy state markets (with markets like Pennsylvania and Colorado beginning to take off), as well as technological and business-model innovation to improve product offerings in the solar-plus-storage space.
3.2 Non-residential PV
Key Figures
- 445 MWdc installed in Q3 2019
- Flat over Q2 2019
- Down 6% from Q3 2018
Non-residential installations have essentially remained flat since Q1 2019 as California and Massachusetts continue to see declining volumes due to state-level policy reforms and interconnection delays that limit development opportunities. Overall, the non-residential PV market is on track for a down year as the segment acclimates to a reduced incentive environment across major state markets. However, this will be incrementally offset starting in 2020 as the next wave of states with robust community solar mandates – New York, Maryland, Illinois and New Jersey – experience growth.
Recent policy developments in the Northeast will ultimately spur growth in our long-term outlook. New Jersey has proposed revising its transition incentive program, slightly raising incentive values for community solar projects. Significant revisions to the Value of Distributed Energy Resources (VDER) docket in New York have bolstered our long-term forecasts for both commercial and community solar. Meanwhile, Maryland and Maine both passed more aggressive RPS policies, which are expected to boost lagging REC markets. Maine went even further to create a commercial solar tariff and community solar program.
Increasing solar-plus-storage viability will also begin to have an impact on non-residential demand as policymakers and business leaders increasingly consider energy storage in their decisions. New York’s recent development of the Bridge Incentive increases our long-term solar-plus-storage forecasts with further potential upside. By 2023, roughly 30% of total non-residential PV capacity will come from community solar, and 20% of all non-residential capacity is expected to have storage attached.
3.3 Utility PV
Key Figures
- 1,410 MWdc installed in Q3 2019
- Utility PV pipeline currently totals 45.5 GWdc
The U.S. utility solar forecast for 2019-2024 has grown by 9.2 GWdc since last quarter thanks to unprecedented levels of procurement driven by increasing cost-competitiveness with other sources. New project announcements are exceeding project completions as developers and utilities look to safe-harbor as much capacity as possible before the ITC steps down. We also continue to see a growing volume of utility-scale solar in long-term resource plans and requests for proposals.
Since last quarter, the 2019 forecast has increased slightly to 8.4 GWdc. The forecasts for 2020 and 2021 have increased by 1.6 and 2.5 GWdc, respectively. The driver for the near-term increase in the forecast has been our growing confidence in 2019 projects meeting their commercial operation dates (CODs) along with the rise in project announcements. There were 8.1 GWdc of new projects announced in Q3 2019, including 1.3 GWdc specifically targeting 2020 CODs and 3.3 GWdc targeting 2021 CODs.
Our utility PV forecast has increased by 5.0 GWdc for 2022-2024. While a portion of this can be attributed to 3.2 GWdc of newly procured projects with 2022-2023 target CODs, we expect that utility demand for solar will continue to increase. The cost-competitiveness of utility PV has made it the primary resource for utilities seeking additional energy capacity, as well as those looking to meet more stringent RPS targets. This is in part due to utility PV becoming increasingly cost-competitive with wind, gas and other electricity generation resources. As the wind-focused federal Production Tax Credit steps down, solar begins to fall below the cost of wind on a levelized cost of energy basis in many traditional wind states. In states such as Illinois, Iowa, Kansas, Michigan and the Dakotas, solar competes with wind on a cost basis by the mid-2020s, while also providing a complementary production profile.
The low cost of utility PV has also increased demand from corporate offtakers: 4.8 GWdc of utility-scale solar projects with corporate offtakers have been announced thus far in 2019. Currently, 3.9 GWdc of the projects expected to come online in 2020 have a corporate offtaker, representing 28% of the 2020 forecast. While a short-term increase in demand could be inflated by corporate offtakers securing low-priced power-purchase agreements before the ITC steps down, we believe offsite corporate demand will continue to grow across the U.S. as more corporate and industrial offtakers pledge to become carbon-neutral or powered by 100% renewables. Consequently, Wood Mackenzie expects that corporate demand will drive more than 20% of utility solar development from 2019-2024.
4. National Solar PV System Pricing
We employ a bottom-up modeling methodology to capture, track and report national average PV system pricing for the major market segments. Our bottom-up methodology is based on tracked wholesale pricing of major solar components and data collected from multiple interviews with industry stakeholders.
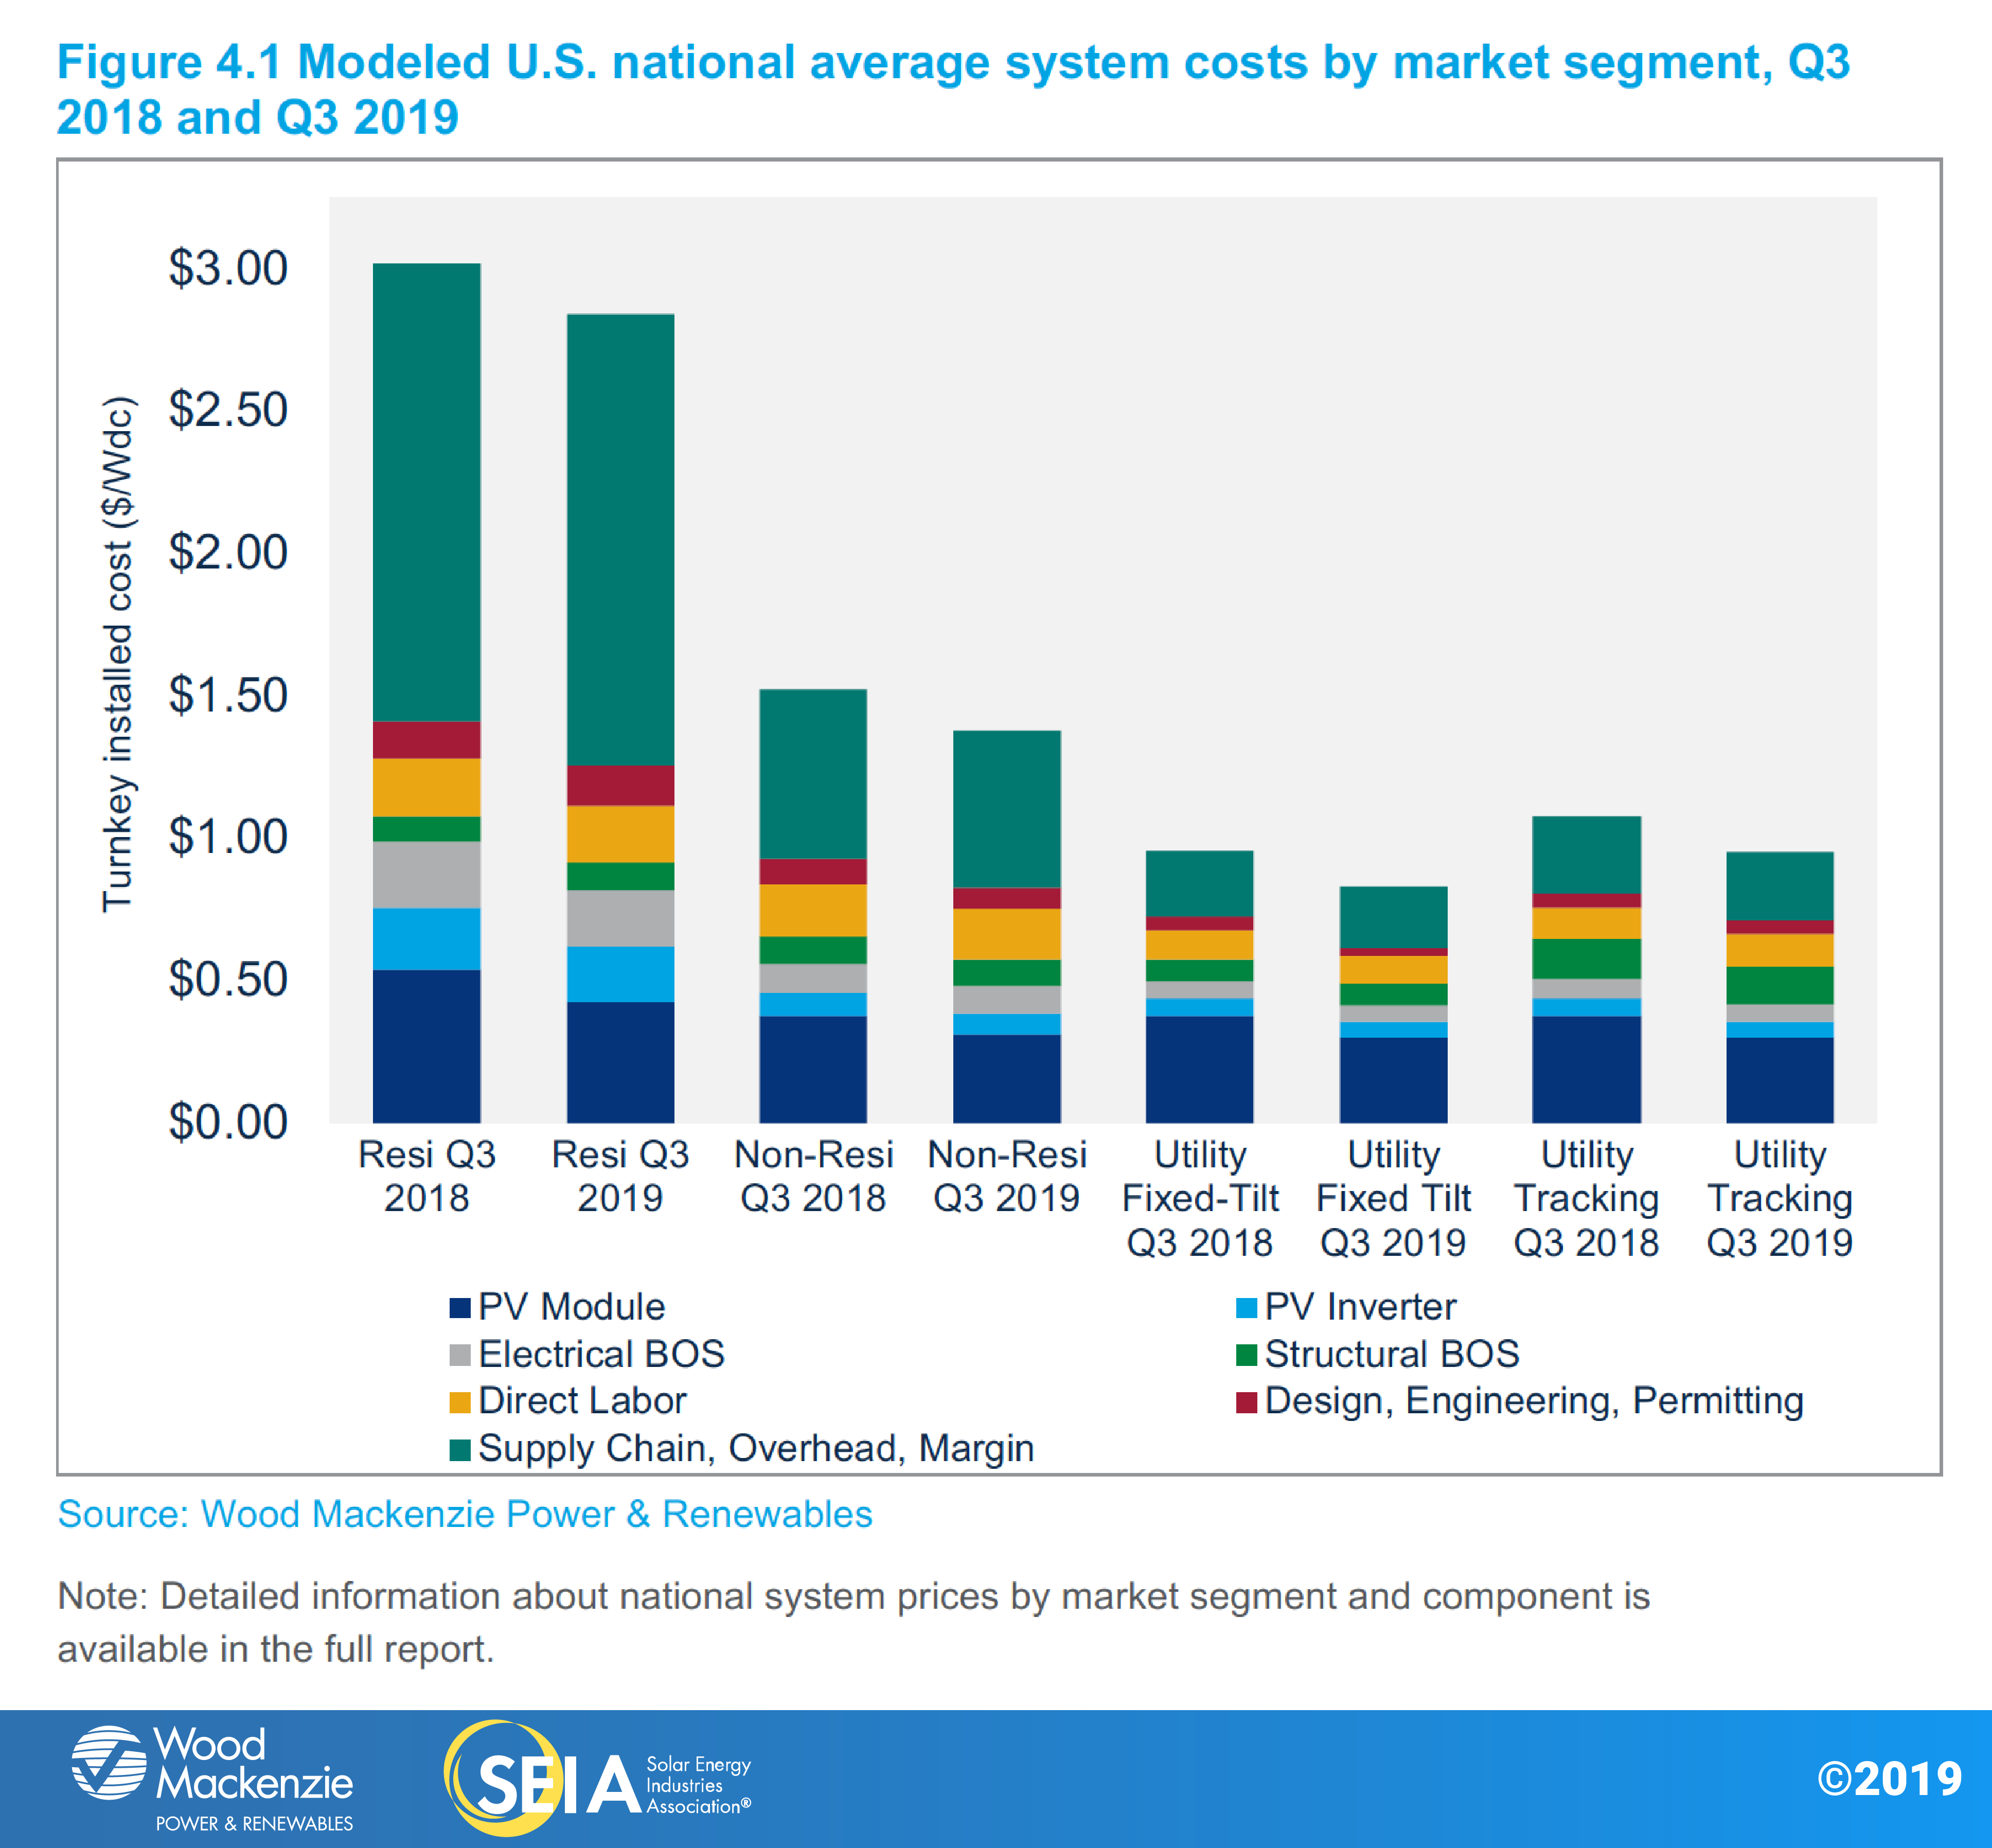
In Q3 2019, system pricing fell across all market segments. System pricing fell quarter-over-quarter by 1.0%, 5.0%, 7.5% and 5.6% in the residential, non-residential, utility fixed-tilt and utility single-axis tracking markets, respectively. Prices across all market segments are now at an all-time low: $2.84/Wdc, $1.38/Wdc, $0.83/Wdc and $0.95/Wdc for residential, non-residential, utility fixed-tilt and utility single-axis tracking systems, respectively. Year-over-year system pricing fell by 6.0%, 9.4%, 13.1% and 11.6% in the residential, non-residential, utility fixed-tilt and utility single-axis tracking markets, respectively.
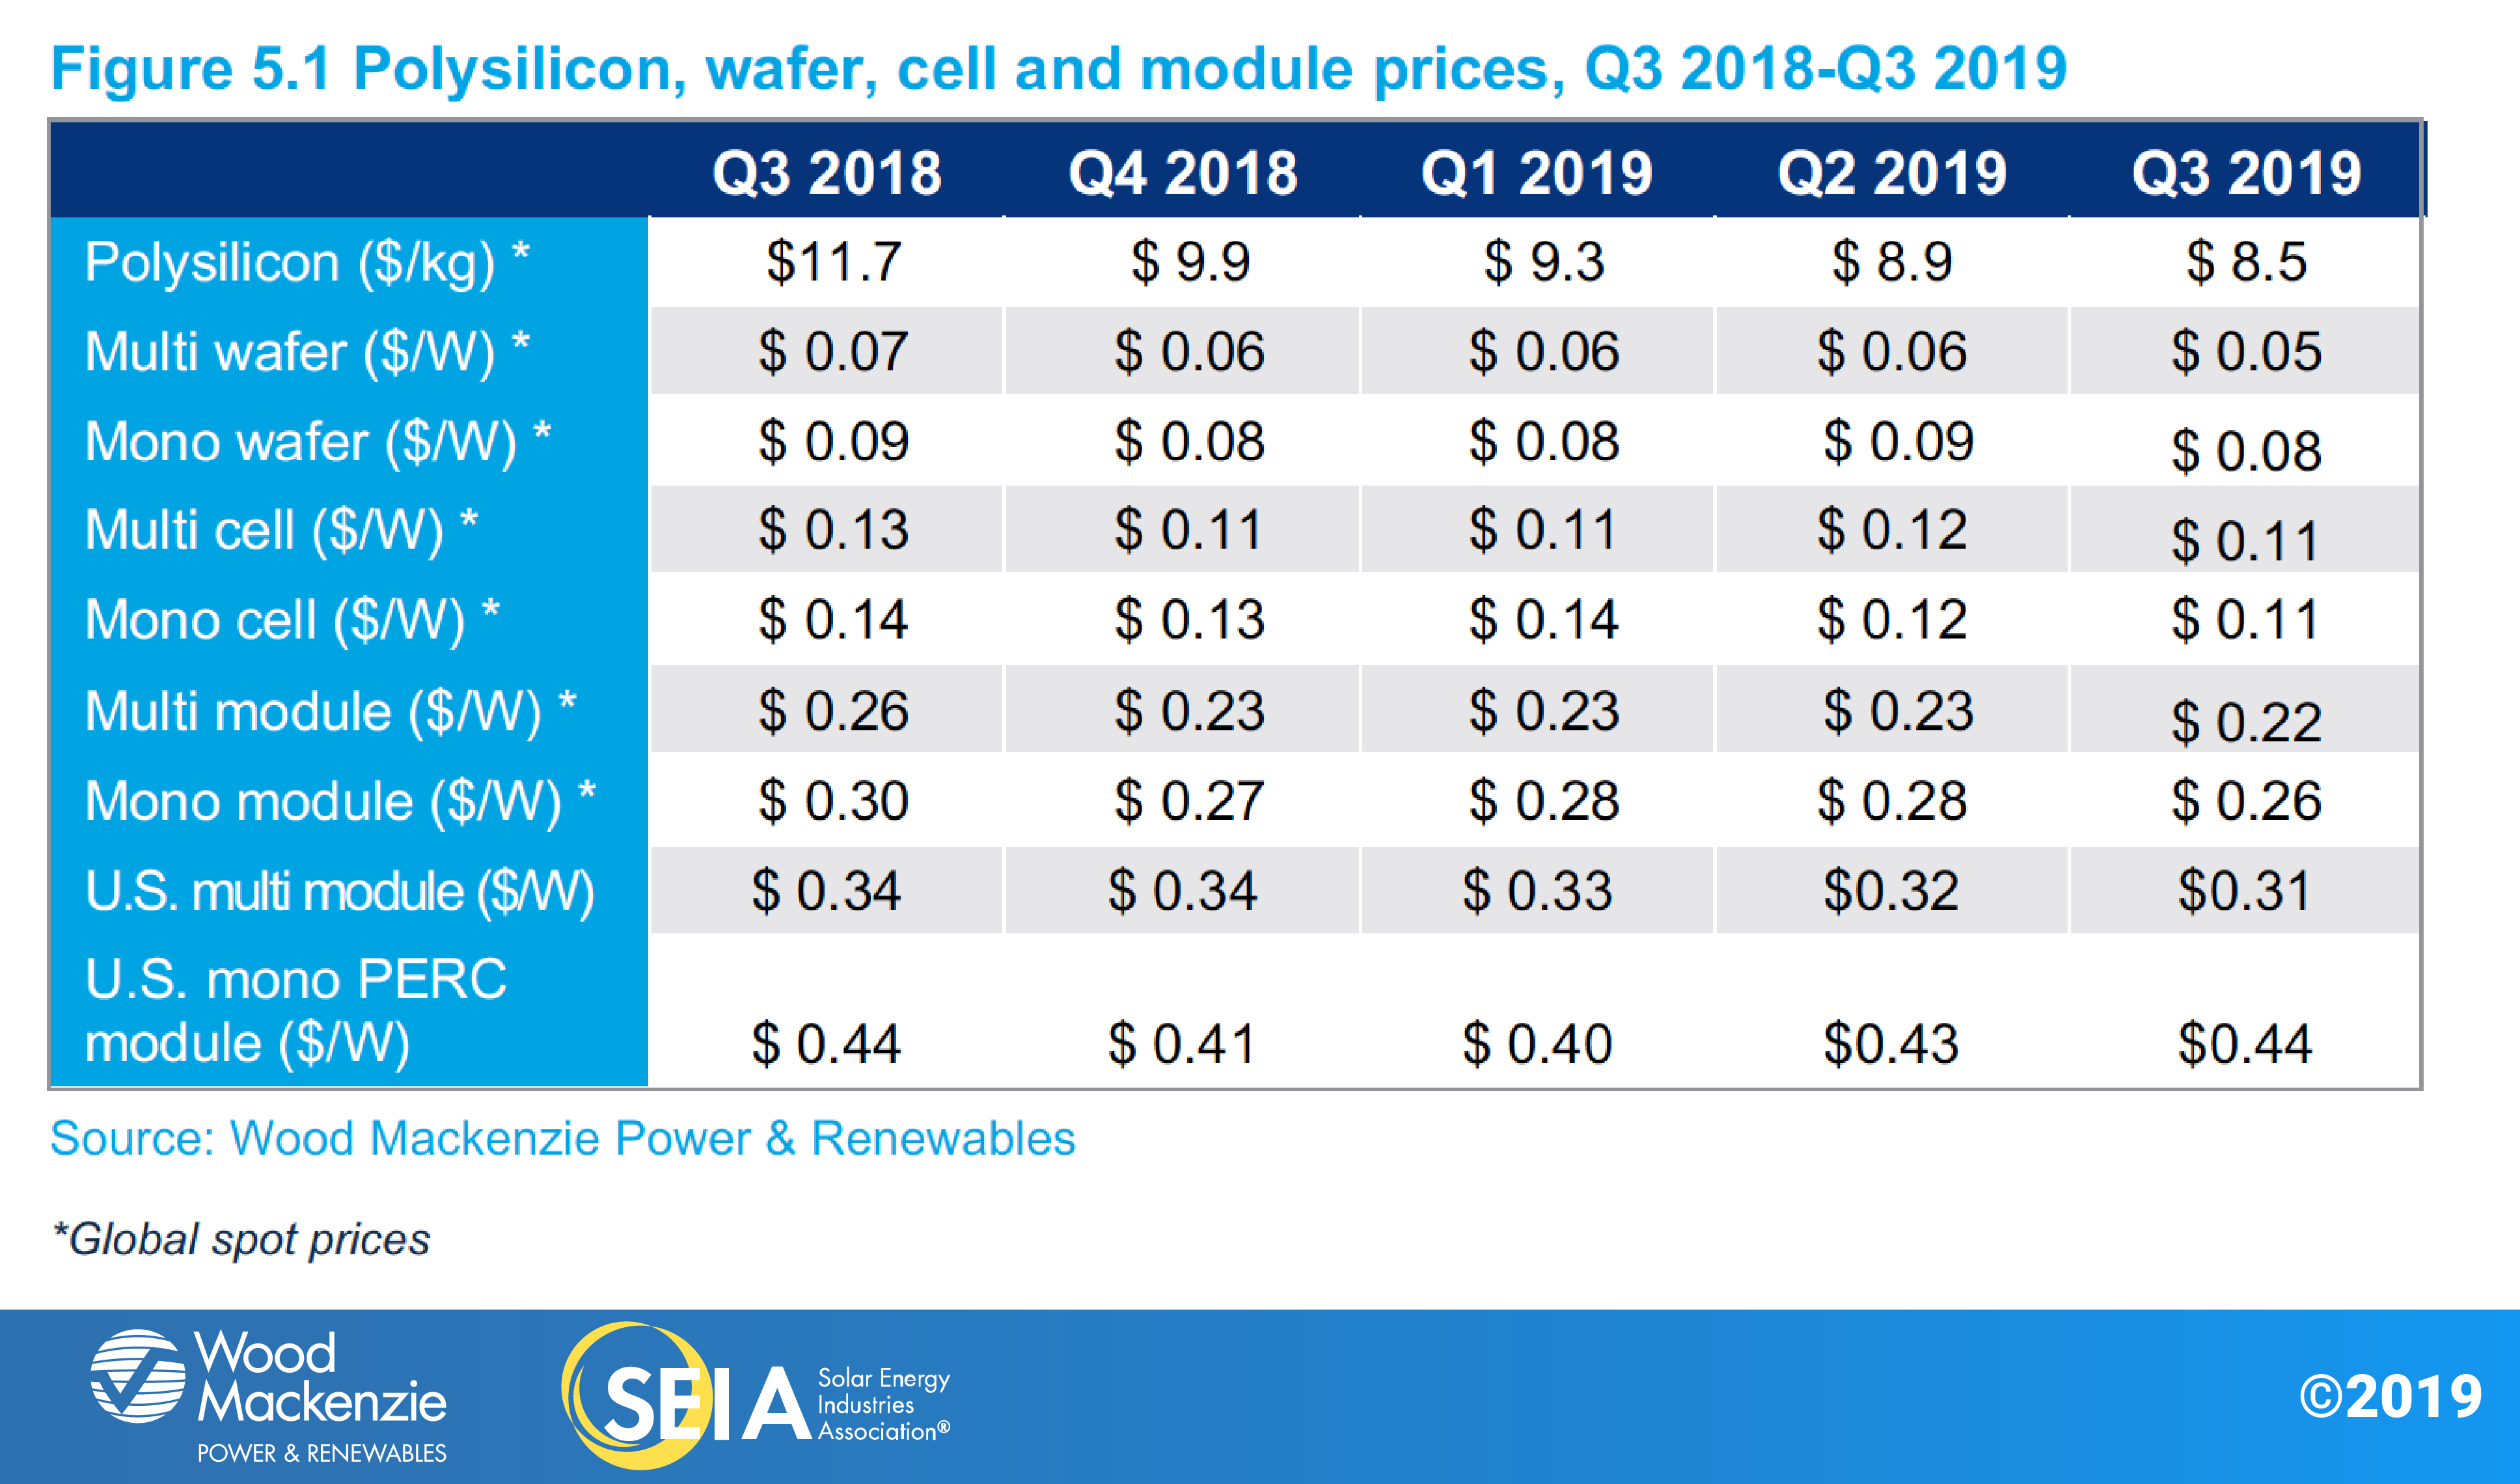
5. Component Pricing
Starting in Q1 2019, the U.S. Solar Market Insight report series expanded its coverage to include pricing information on mono wafer, mono cells and mono modules, in addition to their multi counterparts. In Q3 2019, global spot market pricing for all major components dropped slightly from Q2. Polysilicon prices decreased by more than 4% in Q3, creating a trickle-down price reduction along the entire supply chain. Mono cell global spot prices continued to fall for the second quarter in a row, further confirming that the market has excess supply. Compared to Q2, mono module prices were 2 cents lower in Q3, thanks to the continuous expansion of mono cell and module production capacities around the globe.
In the U.S., multi-silicon module prices declined slightly to $0.31/W in Q3 2019 from $0.32/W in Q2 2019. (Note: U.S. multi-silicon module prices have been lowered retroactively due to an update in our methodology for module pricing.)
For the second quarter in a row, mono PERC module prices increased. In Q3, the U.S. average utility-scale mono PERC module price was around $0.44/W, 10% higher than at the beginning of the year. It reflects the strong demand for the product as well as tight module supply to the U.S. market due to tariffs.