Best Energy ETFs (2026 Data): 40 Oil, Gas, Nuclear, Grid and Clean Energy Funds Compared
Updated: November 2026 · Fund prices and returns: close of 6 November 2026 · Data: fund issuers (State Street, Vanguard, iShares, First Trust, Global X, Sprott, VanEck, ALPS, USCF), EIA, IEA, Cameco · Primary sources listed at the end
Key figures
- +43.6%: one-year total return of XLE, the largest energy ETF, to 6 November 2026, against +10.9% for the S&P 500 (SPY)
- +109% and +114%: the oil futures funds USO and BNO over the same year, after the Iran war pushed Brent spot from $61 at the end of 2025 to a peak of $138 on 6 April (EIA)
- −28.1%: the Global X Uranium ETF (URA) over the year, while the uranium spot price rose 14.4%
- $40.5 billion: XLE's assets, up from $11.4 billion when this page was first written in 2020; its fee fell from 0.13% to 0.08%
- 3.55%: energy's weight in the S&P 500 on 5 November 2026, even after the sector's best year since 2022
- −12.0% vs +13.4%: XLE and the solar fund TAN in the single week to 6 November, after the US midterm elections
Oil is having its strongest year since 2022, and energy ETFs show it. The State Street Energy Select Sector SPDR ETF (XLE) returned 43.6% in the 12 months to 6 November 2026, four times the S&P 500. Funds that hold oil futures did better still: the United States Oil Fund (USO) more than doubled as the war with Iran closed most of the Strait of Hormuz and sent Brent spot to $138 a barrel in April.
The rest of the energy shelf tells a different story. Uranium rose 14% over the year, yet the three largest uranium ETFs lost between 22% and 33%. Clean energy funds rallied until June and then fell 30–44%. A natural gas fund, UNG, has lost 88% in five years while the gas price fell by about half. This page compares 40 US-listed energy ETFs across seven groups on assets, fees and returns, explains why the commodity and the fund so often part ways, and checks what happened to the funds on our 2020 list. It is not investment advice.
Energy ETFs at a Glance: The 2026 Scorecard
The table covers every US-listed energy ETF with more than $1 billion in assets, plus smaller funds that are the main option in their niche. Leveraged, inverse and single-stock funds are excluded. Returns are total returns with dividends reinvested, calculated by list.solar from daily adjusted closing prices to 6 November 2026. Because energy fell sharply in the first week of November, these figures are lower than the month-end numbers on issuer websites: XLE's own page shows +59.6% for the year to 31 October.
| Ticker | Fund | What it holds | Assets, $bn | Fee | 2026 YTD | 1 year | 5 years, per year |
|---|---|---|---|---|---|---|---|
| Broad energy sector | |||||||
| XLE | State Street Energy Select Sector SPDR | 21 S&P 500 energy stocks | 40.46 | 0.08% | +40.6% | +43.6% | +20.3% |
| VDE | Vanguard Energy | 111 US energy stocks, all sizes | 10.66 | 0.09% | +38.6% | +41.6% | +19.7% |
| IXC | iShares Global Energy | Global majors incl. Shell, TotalEnergies | 3.06 | 0.37% | +37.9% | +41.4% | +18.9% |
| FENY | Fidelity MSCI Energy | 107 US energy stocks | 2.13 | 0.08% | +38.6% | +41.6% | +19.7% |
| IYE | iShares U.S. Energy | 44 US energy stocks | 1.79 | 0.37% | +39.3% | +42.2% | +18.8% |
| RSPG | Invesco S&P 500 Equal Weight Energy | 24 stocks, about 4–5% each | 0.60 | 0.40% | +34.8% | +36.3% | +19.0% |
| FXN | First Trust Energy AlphaDEX | 40 stocks, factor-weighted | 0.36 | 0.63% | +37.2% | +42.1% | +14.4% |
| Oil and gas sub-industry | |||||||
| XOP | SPDR S&P Oil & Gas Exploration & Production | 51 producers and refiners, equal weight | 3.93 | 0.35% | +39.4% | +39.8% | +12.3% |
| OIH | VanEck Oil Services | 26 oilfield service firms | 1.78 | 0.35% | +25.1% | +27.8% | +12.1% |
| FTXN | First Trust Nasdaq Oil & Gas | 49 US oil and gas stocks | 1.08 | 0.60% | +36.5% | +40.1% | +14.7% |
| IEO | iShares U.S. Oil & Gas Exploration & Production | 51 stocks, 35% refiners | 0.85 | 0.37% | +47.2% | +47.2% | +17.9% |
| IEZ | iShares U.S. Oil Equipment & Services | 36 service firms | 0.35 | 0.37% | +18.7% | +22.3% | +12.1% |
| Pipelines and MLPs | |||||||
| AMLP | Alerian MLP | 21 pipeline MLPs; taxed as a corporation | 12.26 | 0.84% + 0.17% tax | +13.2% | +15.6% | +16.3% |
| EMLP | First Trust North American Energy Infrastructure | Active; pipelines and utilities | 4.12 | 0.95% | +16.1% | +17.3% | +15.2% |
| MLPX | Global X MLP & Energy Infrastructure | 29 pipeline companies and MLPs | 3.44 | 0.45% | +17.9% | +23.2% | +18.3% |
| MLPA | Global X MLP | About 20 MLPs; taxed as a corporation | 2.26 | 0.77% | +13.4% | +15.4% | +15.3% |
| TPYP | Tortoise North American Pipeline | 45 pipeline companies | 0.88 | 0.40% | +17.9% | +21.4% | +16.6% |
| ENFR | Alerian Energy Infrastructure | 29 US and Canadian midstream firms | 0.52 | 0.35% | +19.5% | +25.1% | +17.9% |
| Oil and gas futures | |||||||
| USO | United States Oil Fund | Front-month WTI futures | 1.84 | 0.86% | +114.6% | +109.4% | +21.3% |
| BNO | United States Brent Oil Fund | Front-month Brent futures | 0.71 | 1.15% | +119.7% | +114.4% | +23.1% |
| DBO | Invesco DB Oil | WTI futures, roll-optimised | 0.29 | 0.77% | +96.7% | +92.1% | +13.0% |
| USL | United States 12 Month Oil Fund | 12 consecutive WTI contracts | 0.05 | 1.01% | +74.7% | +68.8% | +15.1% |
| UNG | United States Natural Gas Fund | Front-month Henry Hub futures | 0.57 | 1.17% | −23.7% | −34.0% | −34.1% |
| Nuclear and uranium | |||||||
| URA | Global X Uranium | 60 miners, reactor and component makers | 4.44 | 0.69% | −24.3% | −28.1% | +6.3% |
| NLR | VanEck Uranium and Nuclear | 28 stocks, nuclear utilities first | 2.94 | 0.52% | −28.8% | −33.0% | +11.9% |
| URNM | Sprott Uranium Miners | 26 miners plus physical uranium | 1.69 | 0.75% | −24.8% | −22.3% | +0.2% |
| NUKZ | Range Nuclear Renaissance | 59 utilities, reactor and fuel firms | 0.58 | 0.85% | −14.5% | −19.5% | n/a (2024) |
| URNJ | Sprott Junior Uranium Miners | 42 small and mid-cap miners | 0.29 | 0.80% | −31.9% | −27.6% | n/a (2023) |
| Utilities, grid and electrification | |||||||
| XLU | State Street Utilities Select Sector SPDR | 31 S&P 500 utilities | 23.91 | 0.08% | +3.1% | +0.3% | +8.3% |
| GRID | First Trust Nasdaq Clean Edge Smart Grid Infrastructure | 122 grid equipment and software firms | 10.44 | 0.56% | +1.4% | +0.3% | +9.3% |
| VPU | Vanguard Utilities | 75 US utilities, all sizes | 8.17 | 0.09% | +2.9% | 0.0% | +8.1% |
| VOLT | Tema Electrification | Active; 28 power and grid stocks | 0.98 | 0.75% | +10.3% | +5.9% | n/a (2024) |
| Clean energy | |||||||
| ICLN | iShares Global Clean Energy | 102 solar, wind, utility and fuel-cell stocks | 2.12 | 0.38% | +0.4% | −6.5% | −6.3% |
| TAN | Invesco Solar | 48 solar stocks | 1.08 | 0.70% | −7.2% | −9.3% | −13.7% |
| QCLN | First Trust NASDAQ Clean Edge Green Energy | 57 stocks; Tesla is No. 1 | 0.45 | 0.59% | −3.5% | −6.0% | −11.4% |
| PBW | Invesco WilderHill Clean Energy | 75 small caps, equal weight | 0.31 | 0.63% | −12.7% | −15.0% | −20.2% |
| FAN | First Trust Global Wind Energy | 44 wind stocks | 0.20 | 0.60% | +13.0% | +13.9% | +3.5% |
| CNRG | State Street SPDR S&P Kensho Grid Innovation | 38 clean power stocks | 0.16 | 0.45% | −10.0% | −18.9% | −5.0% |
| PBD | Invesco Global Clean Energy | 123 stocks, tiered equal weight | 0.10 | 0.75% | −5.0% | −8.2% | −11.6% |
| ACES | ALPS Clean Energy | 40 US and Canadian stocks | 0.09 | 0.55% | −15.0% | −19.7% | −18.5% |
Assets: issuer or stockanalysis.com, 5–6 November 2026 (AMLP at 6 Nov; XLU at 5 Nov). Fee: net expense ratio; AMLP adds a 0.17% income-tax expense. Returns: list.solar calculation from daily adjusted closing prices (dividends reinvested) to the close of 6 November 2026; 5-year figures run from 5 November 2021 and are annualised. They can differ from issuer NAV returns by a few tenths of a point.
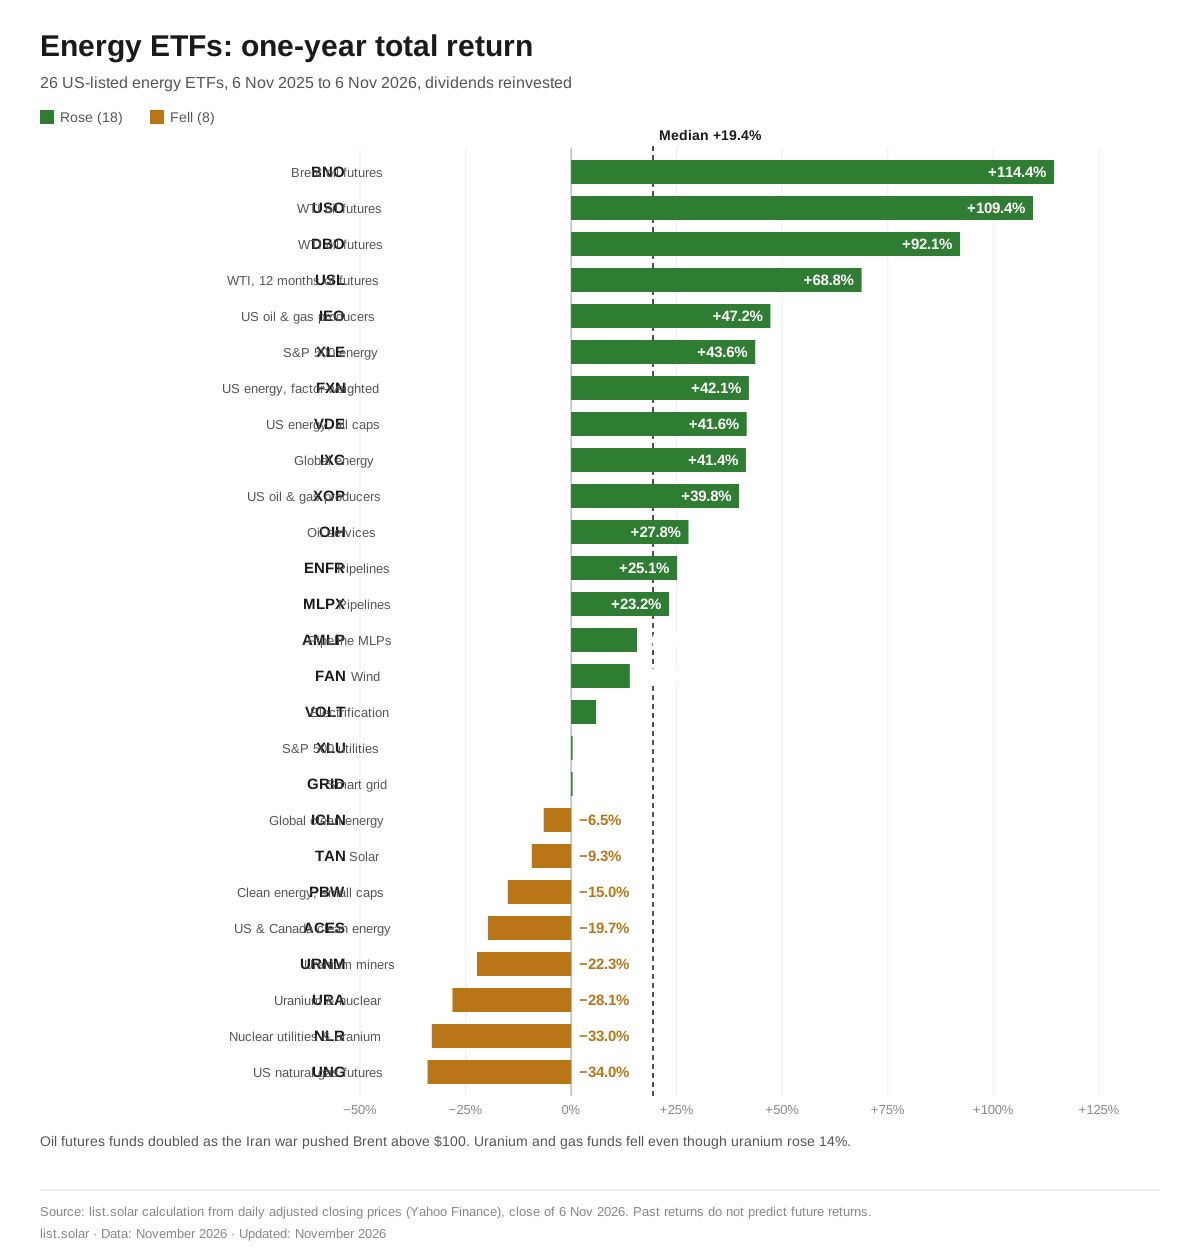
Eighteen of the 26 funds in the chart below rose over the year. The split runs along one line: funds whose holdings earn money from the price of oil gained between 16% and 114%, while funds tied to uranium, gas, solar and grid spending fell or barely moved. The median one-year return was +19.4%.
Broad Energy Sector ETFs: XLE, VDE and IXC
Most investors who want "energy" buy one of these. They hold oil and gas producers, refiners, pipelines and service firms in proportion to market value, which in practice means two companies: ExxonMobil and Chevron. The table shows how much of each fund rides on them.
| Fund | Holdings | Top two holdings | Top two, % of fund | Fee | 30-day SEC yield |
|---|---|---|---|---|---|
| XLE | 21 | ExxonMobil 24.4%, Chevron 18.8% | 43.2% | 0.08% | 2.51% |
| IYE | 44 | ExxonMobil 23.8%, Chevron 16.7% | 40.6% | 0.37% | 2.10% |
| FENY | 107 | ExxonMobil 23.3%, Chevron 15.0% | 38.3% | 0.08% | n/a |
| VDE | 111 | ExxonMobil 22.9%, Chevron 14.5% | 37.4% | 0.09% | 1.75% |
| IXC | 65 | ExxonMobil 18.2%, Chevron 11.3% | 29.5% | 0.37% | 2.56% |
| RSPG | 24 | ExxonMobil 5.1%, Chevron 5.0% | 10.1% | 0.40% | n/a |
Holdings and weights: issuer pages (XLE 5 Nov; VDE 30 Sep; IYE, IXC 5 Nov) and stockanalysis.com (FENY, RSPG, 6 Nov 2026). SEC yield: issuer, 30 Sep–5 Nov 2026.
XLE: the cheapest way to own Exxon and Chevron
XLE is the oldest and largest energy ETF. It launched in December 1998, holds the 21 energy stocks in the S&P 500 and now manages $40.5 billion. State Street has since added its own name to the fund's title, and a 2-for-1 share split on 5 December 2025 explains why the price is about $62 rather than the $120 it would otherwise be. The fund drew its two largest monthly inflows on record in January and February 2026, $2.6 billion and $2 billion, as the war with Iran began (Bloomberg Intelligence). With 43% of the money in two stocks, XLE is a bet on the integrated majors. Its five-year return to 31 October was 23.75% a year at net asset value.
VDE and FENY: the same index family, a longer tail
Vanguard's VDE and Fidelity's FENY both follow MSCI US energy indices with more than 100 stocks, adding small producers and service firms that XLE leaves out. Our calculation shows them within 0.1 point of each other on every period, and FENY charges 0.08% against VDE's 0.09%. Both trailed XLE by about two points over the year as smaller producers lagged the majors.
IXC: the only one with Shell and TotalEnergies
IXC holds the energy stocks in the S&P Global 1200 index, so its top holdings include non-US majors such as Shell (7.9%) and TotalEnergies (4.9%). Its assets grew from $593 million on our 2020 list to $3.06 billion, and iShares cut its fee from 0.46% to 0.37%. It has the highest SEC yield of the group, 2.56%.
RSPG and FXN: avoiding the Exxon bet
RSPG gives each of the 24 S&P 500 energy stocks the same weight, so no company is above 5.1%. That cost about seven points over the past year as the majors outran smaller producers. FXN picks 40 stocks by growth and value factors; its second-largest holding on 6 November was First Solar, at 4.7%. A fund sold as "energy" can hold a solar manufacturer, and FXN's five-year return of 14.4% a year is the lowest of the broad funds.
Oil and Gas Sub-Industry ETFs: Read the Holdings, Not the Name
These funds slice the sector into producers and service companies. Their names are less precise than they look.
- IEO (iShares U.S. Oil & Gas Exploration & Production) had the best 2026 return of any equity fund on this page, +47.2%. But 34.5% of it was refiners on 5 November, with Marathon Petroleum (12.2%) and Valero (11.6%) among its top three holdings. Refiners benefited from a diesel market that the EIA described in October as extremely tight.
- XOP (SPDR S&P Oil & Gas E&P) weights 51 companies roughly equally. On 5 November 67.5% was exploration and production, 23.9% refining and 8.7% integrated majors. It has $3.9 billion in assets.
- OIH and IEZ hold service companies such as SLB, Baker Hughes and Halliburton. They lagged in 2026, at +25% and +19% year to date. IEZ is the most concentrated fund on this page: SLB and Baker Hughes made up 45.3% of it. Its 10-year return to 30 September was −2.2% a year.
- FTXN (First Trust Nasdaq Oil & Gas) passed $1 billion in assets and splits its top weights evenly between Chevron, ExxonMobil and ConocoPhillips at about 8.4% each.
Pipeline and MLP ETFs: Income, With a Tax Twist
Midstream companies move and store oil and gas for a fee, so their earnings depend more on volumes than on prices. That is why pipeline funds rose 13–20% in 2026 while producer funds rose about 40%, and why they fell less in the first week of November: AMLP lost 7.1% and EMLP 3.6%, against 12.0% for XLE.
Structure matters more here than anywhere else in energy. Master limited partnerships send their own investors a K-1 tax form. A fund that puts more than 25% of its assets in MLPs cannot be taxed as a regular investment company, so it pays corporate tax itself.
- AMLP ($12.3 billion) is taxed as a C-corporation and accrues deferred tax in its net asset value. Investors get a 1099, not a K-1, but pay for it: total expenses were 1.01% (0.84% management fee plus 0.17% income-tax expense), and in the year to 30 September the fund returned 19.56% against 25.32% for its index, a gap of 5.8 points. Its trailing distribution yield is 8.1%.
- MLPX ($3.4 billion) caps its MLP exposure, holds Canadian and US pipeline corporations such as TC Energy, Enbridge and Williams, and pays no fund-level tax. It had the best three-year return of the oil, gas and pipeline equity funds here, 27.9% a year to 31 October.
- EMLP ($4.1 billion) is actively managed and also holds utilities, which cushioned it in the November sell-off.
- ENFR and TPYP are low-cost (0.35% and 0.40%) index funds of US and Canadian midstream corporations.
Oil and Gas Futures Funds: USO, BNO and UNG
Commodity funds do not own companies. They hold futures contracts and Treasury bills, and every month they sell the contract about to expire and buy the next one. When later contracts cost more than the current one (contango), each roll loses money. When they cost less (backwardation), each roll adds to returns. That mechanism, not the oil price alone, decides what investors earn.
The United States Oil Fund is the clearest case. In April 2020 the front-month WTI contract briefly went below zero, and by 28 April the fund's net asset value had fallen to $2.04 a share. USO carried out a 1-for-8 reverse split after the close on 28 April 2020, which turned 1.48 billion shares into 185 million. After CME capped its positions, it spread its holdings across the June to September 2020 contracts and warned in an SEC filing that it would "likely continue to experience greater effects from contango." USO lost 67.8% in calendar 2020, while the monthly average WTI price fell 21.5%.
In 2026 the curve flipped. With prompt barrels scarce, near-month oil traded far above later months, and the funds that hold the nearest contracts gained most. USO returned 117.4% in the 12 months to 3 November, against 61.3% for WTI spot and 75.8% for USL, which spreads its money across 12 monthly contracts. BNO, the Brent version, did slightly better than USO over the year. USO and BNO are limited partnerships that issue K-1 tax forms.
Natural gas shows the other side. UNG, which holds Henry Hub futures, lost 88.3% in the five years to 3 November 2026 while the spot gas price fell 53.0%. Henry Hub was $2.63 per million British thermal units on 3 November, down 29% from a year earlier, as rising US output offset growing LNG exports (EIA). Since its 2007 launch UNG has lost 99.9% of its value. It is a trading tool, not an investment.
Nuclear and Uranium ETFs: The Commodity Rose, the Funds Fell
Uranium ended October at $91.55 a pound on Cameco's month-end spot price, 14.4% higher than a year earlier, and the long-term contract price reached a record $98. Nuclear policy was favourable: four US executive orders in May 2025 set a goal of quadrupling US nuclear capacity to 400 GW by 2050, and on 6 October 2026 Google signed a 20-year deal with Constellation for 890 MW of extra output from upgraded reactors.
The ETFs went the other way. URA, the largest at $4.4 billion, fell 28.1% over the year to 6 November; NLR fell 33.0% and URNM 22.3%. On 6 November they stood 46–51% below their 52-week highs, set in late January. Sprott, which runs URNM, called it a liquidity shock driven by leveraged investors selling, and said inflows into its fund kept rising as prices fell.
The funds differ more than their names suggest:
- URA (Global X, 0.69%) mixes miners with reactor developers and component makers. Cameco is 22.5% of it; the reactor developer Oklo is 4.5%. Its five-year return to 31 October was 8.9% a year at net asset value.
- NLR (VanEck, 0.52%) is mostly a nuclear utility fund: PSEG (10.2%), Constellation (9.4%) and Fortum (8.5%) come before Cameco. It is the cheapest of the group.
- URNM (Sprott, 0.75%) holds companies with at least half their assets in uranium, plus about 17% in the Sprott Physical Uranium Trust. It is the closest ETF to a pure uranium bet.
- NUKZ (Range, 0.85%) spreads 59 holdings across utilities, reactor builders and fuel suppliers; Cameco is the only position above 4%. It fell least in 2026.
Investors who want the metal itself can buy the Sprott Physical Uranium Trust (Toronto: U.U in US dollars; US over the counter: SRUUF). It held 81.7 million pounds of uranium worth $7.5 billion on 6 November. Its net asset value is up 11.4% this year, but the units traded at $18.51 against a value of $22.05, a 16% discount, and the trust traded below its value on every day of the third quarter. It is a closed-end trust, not an ETF, and US taxpayers face PFIC rules.
Utilities, Grid and Electrification ETFs
Power demand is the other energy story of 2026. Electricity load across the lower 48 US states averaged a record 541 GW in September (FactSet via First Trust), and the IEA expects data-centre electricity use to more than double to about 945 TWh by 2030. Three types of fund give exposure to it.
- Utilities: XLU ($23.9 billion, 0.08%) and VPU ($8.2 billion, 0.09%) were roughly flat over the year after a weak summer and a 10.2% gain for XLU in October alone. XLU's three-year return was 16.7% a year to 31 October. NextEra is the top holding of both, at 13.5% in XLU.
- Grid equipment: GRID ($10.4 billion, 0.56%) holds the companies that build and equip the network: Johnson Controls, Quanta Services, Eaton, ABB and Schneider Electric. It took $3.1 billion of new money in the second quarter of 2026 alone (Morningstar) and returned 24.8% a year over three years to 30 September. It is now 24% below its 52-week high after a sharp fall in early November.
- Electrification: VOLT, an actively managed Tema fund launched in December 2024, passed $1 billion in assets on 3 November 2026. It holds both utilities (NextEra, AEP) and component makers (Amphenol, Bel Fuse).
Clean Energy ETFs: A Round Trip in Six Months
Clean energy funds rose by about 47% in 2025 (ICLN +47.0%, TAN +48.3%), the best year since 2020, and kept climbing into 2026 on power demand and the energy-security argument that the Iran war revived. Nearly all of them peaked on 2 June 2026. On 6 November PBW was 44% below that high, TAN 38%, QCLN 37% and ICLN 31%. Three things turned them:
- Tax credits: under the July 2025 budget law, US wind and solar projects that began construction after 4 July 2026 must be in service by the end of 2027 to claim credits, and the household solar credit (Section 25D) ended on 31 December 2025 (IRS).
- Interest rates: the Federal Reserve raised its target range by a quarter point to 3.75–4.00% on 16 September 2026. Clean energy companies borrow heavily, and QCLN lost 21.2% in the third quarter.
- Earnings: First Solar, a top-two holding in both ICLN and TAN, fell more than a third from its June high of $320.95 (CNBC).
The first week of November reversed part of the slide. TAN gained 13.4% and ICLN 7.4% in the week to 6 November, while XLE lost 12.0%; CNBC tied the solar rebound to the midterm election results, which investors read as a check on further cuts to clean energy support.
Among the funds, ICLN is the largest and cheapest broad option ($2.1 billion, 0.38%), with Nextpower (9.5%) and First Solar (9.1%) as its top holdings. TAN is the solar fund. FAN, the wind fund, is the only clean energy ETF that rose over the year (+13.9%); its largest holdings are Nordex, Ørsted and EDP Renewables. QCLN is closer to a technology fund, with Tesla, Monolithic Power and ON Semiconductor at the top and semiconductors as its largest industry (23.5%).
Small funds are the risk. ACES has $92 million, down from $172 million in 2020, and four clean energy or hydrogen ETFs closed between July 2024 and April 2025: Direxion's HJEN and KLNE, Goldman Sachs' GCLN and Defiance's HDRO. A fund that closes returns cash at the net asset value, often at a bad time and with a tax bill. For a fund-by-fund comparison of solar and renewable funds, see our pages on solar ETFs and renewable energy ETFs.
Energy vs the S&P 500 vs Clean Energy, 2020–2026
No energy fund leads for long. The table shows calendar-year total returns for six funds that represent the main groups. The best performer changed every year, and no fund came first two years running.
| Year | XLE (oil and gas) | USO (oil futures) | URA (uranium) | ICLN (clean energy) | XLU (utilities) | SPY (S&P 500) | XLE minus SPY, points | Best of the six |
|---|---|---|---|---|---|---|---|---|
| 2020 | −32.7% | −67.8% | +41.3% | +141.8% | +0.5% | +18.3% | −51.0 | ICLN |
| 2021 | +53.3% | +64.7% | +57.6% | −24.2% | +17.7% | +28.7% | +24.6 | USO |
| 2022 | +64.3% | +29.0% | −11.3% | −5.4% | +1.4% | −18.2% | +82.5 | XLE |
| 2023 | −0.6% | −4.9% | +46.2% | −20.4% | −7.2% | +26.2% | −26.8 | URA |
| 2024 | +5.6% | +13.4% | −0.6% | −25.7% | +23.3% | +24.9% | −19.3 | SPY |
| 2025 | +7.9% | −8.5% | +67.2% | +47.0% | +16.0% | +17.7% | −9.8 | URA |
| 2026 to 6 Nov | +40.6% | +114.6% | −24.3% | +0.4% | +3.1% | +8.7% | +31.9 | USO |
Total returns with dividends reinvested, list.solar calculation from daily adjusted closing prices. Our figures match issuer calendar-year NAV returns within about half a point (for example, ICLN 2025: +47.0% vs +46.59% on the iShares fact sheet; S&P 500 Energy Select Sector Index 2026 to 31 October: +59.68%, SSGA).
Two patterns stand out. Energy beat the S&P 500 in only three of the seven years, but by wide margins when it did: 82.5 points in 2022 and 31.9 points so far in 2026. Clean energy beat both only in 2020 and 2025.
What Happened to the Funds on Our 2020 List
The previous version of this page, written in 2020, recommended eight funds. All eight still trade. The table shows their size and fee then and now, and the total return from 31 December 2019, the last year-end before that page was written.
| Fund | 2020 page: assets / fee | Now: assets / fee | Total return, 31 Dec 2019 – 6 Nov 2026 | Per year | 5 years, per year |
|---|---|---|---|---|---|
| XLE | $11.4bn / 0.13% | $40.5bn / 0.08% | +169.7% | +15.6% | +20.3% |
| VDE | $1.99bn / 0.10% | $10.7bn / 0.09% | +170.3% | +15.6% | +19.7% |
| IXC | $593m / 0.46% | $3.06bn / 0.37% | +140.3% | +13.7% | +18.9% |
| AMLP | $8.03bn / 0.85% | $12.3bn / 0.84% + tax | +111.0% | +11.5% | +16.3% |
| USO | $1.39bn / 0.84% | $1.84bn / 0.86% | +44.8% | +5.6% | +21.3% |
| TAN | $530m / 0.71% | $1.08bn / 0.70% | +49.0% | +6.0% | −13.7% |
| QCLN | $178m / 0.60% | $454m / 0.59% | +77.8% | +8.8% | −11.4% |
| ACES | $172m / 0.65% | $92m / 0.55% | −13.4% | −2.1% | −18.5% |
| SPY (S&P 500), for comparison | +151.2% | +14.4% | +10.9% |
2020 figures as published on this page in 2020. Current assets and fees: issuers and stockanalysis.com, 5–6 November 2026. Returns: list.solar calculation from adjusted closing prices; the 5-year column runs from 5 November 2021.
Almost seven years on, only XLE and VDE beat the S&P 500, and only just: about 170% against 151%, after heavy losses in 2020 and two war-driven rallies in 2022 and 2026. The start date matters enormously. Measured from 31 March 2020, the date of the prices quoted on the old page and close to the pandemic low, XLE is up 445%. Measured from the clean energy peak in February 2021, TAN is down 63%.
The old page also linked IXC to our page about the iShares Global Clean Energy fund. IXC is the iShares Global Energy fund, and its largest holdings are ExxonMobil and Chevron.
Myth: A Commodity Boom Lifts the ETF That Tracks It
The most common mistake with energy ETFs is to treat them as the commodity in their name. They are not, and 2026 offered three clean examples.
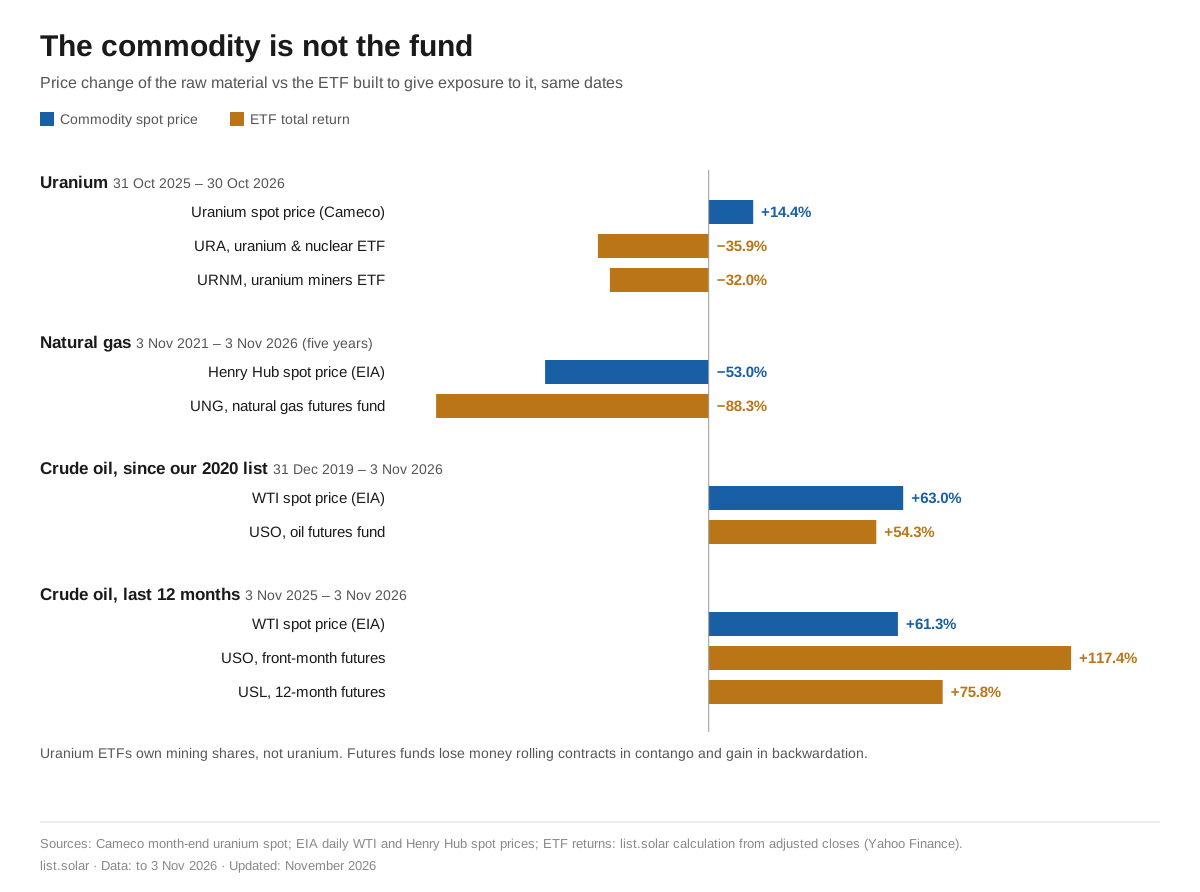
Uranium funds own companies, not uranium. From the end of October 2025 to the end of October 2026 uranium spot rose 14.4%. URA fell 35.9% and URNM 32.0% over the same dates. Mining shares carry costs, debt, permits and stock-market sentiment, and when leveraged investors sold in October, the shares fell regardless of the metal.
Futures funds earn the roll, not the price. Over five years UNG lost 88% while gas fell 53%, because a market in contango charges the fund every month. Since the end of 2019 USO has returned 54% while WTI rose 63%. In the past 12 months the effect ran in USO's favour: in backwardation it beat the spot price by 56 points. The direction of the curve matters as much as the price.
Equity funds follow profits. Producers' earnings rise with oil, but service companies (OIH, IEZ) earn only when producers drill more, and they did not. Pipelines earn on volumes. That is why the oil equity funds rose by 15–47% in a year when the oil price rose by about 60%.
The 2026 Backdrop: War, OPEC+ and Rates
The US and Israel struck Iran in late February 2026. Brent spot, $61.35 on 31 December 2025, passed $120 in late March and peaked at $138.21 on 6 April, according to the US Energy Information Administration. It fell to about $70 by early July, spiked again to $135.51 on 2 October, when the EIA pointed to attacks on Saudi Arabia's East-West pipeline, and stood at $107.03 on 3 November. Shipping attacks were still being reported in the Strait of Hormuz in the first week of November (UKMTO via Argus).
In its 6 October Short-Term Energy Outlook, the EIA forecast Brent at $96 a barrel on average in 2026, $105 in the fourth quarter and $84 in 2027. The agency's November outlook is due on 10 November and will update those numbers.
- OPEC+: the United Arab Emirates left OPEC and OPEC+ with effect from 1 May 2026. The remaining seven countries in the voluntary-cut group raised quotas by 188,000 barrels a day for June and again for September, then kept December output unchanged at their meeting on 1 November. The next meeting is on 29 November. With Gulf exports physically constrained, quotas matter less than shipping routes.
- Rates: the Federal Reserve raised rates on 16 September 2026, to 3.75–4.00%, and held them on 28 October. Higher rates weigh most on utilities, clean energy and other capital-heavy businesses.
- Investment: the IEA's World Energy Investment 2026 report puts global energy investment at $3.4 trillion this year, of which about $2.2 trillion goes to grids, storage, renewables, nuclear and efficiency and about $1.2 trillion to fossil fuels. Spending on gas supply is at a 10-year high and on coal at its highest since 2012.
- Weight: after the rally, energy is still only 3.55% of the S&P 500, against 35.5% for information technology (5 November 2026). A broad index fund gives very little energy exposure.
For futures prices of oil, gas, uranium and power metals, see our energy commodities page.
For Investors in Europe: UCITS Alternatives
Retail investors in the European Union generally cannot buy US-listed ETFs such as XLE or URA. EU rules require a key information document (KID) under the PRIIPs regulation, and US issuers do not produce one, so brokers block the funds. Irish-domiciled UCITS ETFs cover most of the same ground:
| UCITS fund | Ticker | Closest US equivalent | Fee (TER) | Assets |
|---|---|---|---|---|
| iShares S&P 500 Energy Sector UCITS ETF | IUES | XLE | 0.15% | $2.09bn |
| Xtrackers MSCI World Energy UCITS ETF | XDW0 | IXC | 0.25% | €1.85bn |
| SPDR MSCI World Energy UCITS ETF | WNRG | IXC | 0.30% | €572m |
| iShares Global Clean Energy Transition UCITS ETF | INRG | ICLN | 0.65% | $3.21bn |
| VanEck Uranium and Nuclear Technologies UCITS ETF | NUCL | NLR / URA | 0.55% | €1.54bn |
IUES: iShares fact sheet, 31 Oct 2026. INRG: iShares UK, 6 Nov 2026. XDW0, WNRG, NUCL: justETF, about 30 Sep 2026, because the issuer pages did not load. Tickers shown are the main London or Xetra listings.
INRG, the European twin of ICLN, is larger than its US original and costs more (0.65% against 0.38%). The MSCI World energy funds hold about 50 stocks, roughly 61% in the US, 14% in Canada and 11% in the UK, so they include BP and Shell as well as Exxon and Chevron. Returns in euros differ from dollar returns: XDW0 was up 45.6% in euros to the end of September.
Ukraine: Buying Foreign ETFs Under Martial-Law Currency Rules
Since 11 August 2026, Ukrainian residents can use their monthly limit for buying foreign currency, raised by the National Bank of Ukraine from UAH 50,000 to UAH 200,000, to buy securities of foreign issuers through Ukrainian intermediaries (NBU Resolution No. 90 of 10 August 2026). On about 5 August the National Securities and Stock Market Commission admitted five more foreign UCITS ETFs to circulation in Ukraine, at the request of the broker Altera Finance; the units are held through the National Depository's account at Clearstream. Transferring money abroad to a foreign broker for investment remains a restricted capital operation: the NBU's own roadmap places "investments abroad" in the last stage of currency liberalisation. We could not find a public list of the admitted funds, so a Ukrainian investor should ask a licensed domestic broker whether any energy ETF is among them.
How to Choose an Energy ETF
- Decide what you want to own: companies (equity ETFs), the commodity price (futures funds, which suit trades of weeks, not years), income (pipelines) or a theme such as nuclear or grid spending. The return gaps above come mostly from that choice.
- Check concentration: two stocks make up 43% of XLE and 45% of IEZ. RSPG and NUKZ spread the risk.
- Check the tax wrapper: USO, BNO and UNG are partnerships that issue K-1 forms. AMLP and MLPA pay corporate tax inside the fund. Ordinary equity ETFs issue a 1099.
- Compare fees within a group, not across groups: 0.08% for XLE and FENY is the floor; above 0.60% a broad energy fund needs a reason.
- Be careful with the smallest funds: four clean energy and hydrogen ETFs closed in 2024–2025, and ACES and PBD now hold about $100 million or less.
- Use the right dates: XLE's year-to-date return dropped from 59.6% on 31 October to 40.6% on 6 November. A fund page dated the end of last month can be far from today's price.
Investors who want companies that store energy rather than produce it can compare energy storage stocks and energy storage ETFs; the battery and lithium funds are covered in best lithium battery ETFs.
Methodology and Data Sources
The fund list includes every US-listed, unleveraged energy-equity, MLP and energy-commodity ETF with more than $1 billion in assets on 6 November 2026 (from issuer pages and the etfdb.com energy and MLP categories), plus the largest funds in the nuclear, utility, grid and clean energy groups and smaller funds that appeared on our 2020 list. Leveraged, inverse, covered-call and single-stock funds are excluded.
Assets, fees, holdings and SEC yields come from issuer pages where they loaded (State Street, Vanguard, iShares, First Trust, Global X, Sprott, VanEck, ALPS) and from stockanalysis.com otherwise (Invesco, USCF and Fidelity pages did not return data). Dates are shown under each table. Returns are list.solar calculations from Yahoo Finance daily adjusted closing prices, which reinvest dividends, to the close of 6 November 2026: year to date from 31 December 2025, one year from 6 November 2025, five years annualised from 5 November 2021. We checked them against issuer NAV returns where available: VDE year to date 38.6% vs Vanguard's 38.52%, IYE 39.3% vs 39.27%, ICLN three-year and five-year within 0.2 points. The commodity comparison uses EIA daily spot prices for WTI and Henry Hub to 3 November 2026 and Cameco's month-end uranium spot price, matched to fund returns over the same dates. Calendar-year returns are our calculation from the same price series. All prices are in US dollars unless marked. Next update: after the first quarter of 2027.
Past returns do not predict future returns. This page is for information and is not investment advice. List.solar has no commercial relationship with any fund issuer and uses no affiliate links.
FAQ
If oil or uranium prices rise, will an energy ETF rise as much?
No. Equity ETFs follow company profits and investor sentiment, and futures funds depend on the cost of rolling contracts. Between October 2025 and October 2026 uranium rose 14.4% while the URA ETF fell 35.9%. Over five years natural gas fell 53% and the UNG fund lost 88%. In 2026's oil spike, USO gained 117% in a year while WTI rose 61%.
What is the best energy ETF in 2026?
By assets and cost, XLE: $40.5 billion, a 0.08% fee and a one-year return of 43.6% to 6 November 2026. FENY charges the same fee with 107 stocks instead of 21. The best one-year performer was BNO (+114.4%), an oil futures fund that suits short-term trading rather than long holding.
Is XLE or VDE better?
XLE is cheaper (0.08% against 0.09%), more liquid and more concentrated, with 43% in ExxonMobil and Chevron. VDE holds 111 stocks including small producers. Over five years to 6 November 2026, XLE returned 20.3% a year and VDE 19.7%. The difference comes from the small caps, which lagged the majors in 2026.
What is the best nuclear energy ETF?
It depends on the exposure. URA ($4.4 billion, 0.69%) mixes uranium miners with reactor developers. NLR (0.52%) is the cheapest and holds mainly nuclear utilities. URNM is the purest uranium-mining fund. All three fell 22–33% in the year to 6 November 2026 even though uranium rose. NUKZ, the most diversified, fell least.
Are clean energy ETFs a good alternative to oil ETFs?
They have behaved as opposites. Clean energy funds led in 2020 and 2025, oil funds in 2021, 2022 and 2026. Since the end of 2019 ICLN has returned 51% and XLE 170%, while over the past year ICLN lost 6.5%. Holding both reduces the risk of owning only the wrong one, but neither has been a steady performer.
Related on List.Solar
- Top Solar ETFs: TAN and other solar funds compared
- Top Renewable Energy ETFs: wind, solar and clean power funds
- Energy Storage Stocks: battery makers and integrators compared on 2026 data
- Energy Commodities: oil, gas and metals prices
Sources
- State Street Global Advisors, fund pages for XLE (assets, holdings, NAV returns to 31 Oct 2026, index returns), XLU, SPY (S&P 500 sector weights, 5 Nov 2026) and XOP, CNRG, accessed 7 Nov 2026
- Vanguard, VDE profile and performance, 31 Oct and 6 Nov 2026
- iShares (BlackRock), fund pages for ICLN, IXC, IYE, IEO, IEZ; ICLN fact sheet (calendar returns to 2025); INRG; IUES fact sheet, 31 Oct–6 Nov 2026
- First Trust, fund summaries for GRID, QCLN, FAN, FXN, FTXN, EMLP, 30 Oct–6 Nov 2026; Drilling into energy stocks, 20 Oct 2026
- ALPS, AMLP and ENFR fact sheets, 30 Sep 2026; Global X, MLPX, MLPA and URA, 6 Nov 2026
- Sprott, URNM, URNJ and Sprott Physical Uranium Trust, 6 Nov 2026; Uranium miners: a liquidity shock, not a broken thesis, 28 Oct 2026
- VanEck, NLR and OIH, 6 Nov 2026; Range ETFs, NUKZ, 31 Oct 2026; Tema, VOLT exceeds $1 billion, Nov 2026
- Stockanalysis.com ETF pages (assets, fees, holdings) for Invesco, USCF, Fidelity and other funds, e.g. USO, TAN, FENY, accessed 7–9 Nov 2026; daily adjusted prices: Yahoo Finance, 10 Nov 2026
- United States Oil Fund, SEC filings: reverse split, Apr 2020; change in holdings and contango risk, 24 Apr 2020
- US Energy Information Administration, daily spot prices for Brent, WTI and Henry Hub, data to 3 Nov 2026; Short-Term Energy Outlook, 6 Oct 2026
- Cameco, uranium spot and long-term prices, 30 Oct 2026
- OPEC, press releases of 3 May, 2 August and 1 November 2026; Enerdata, UAE announces exit from OPEC, 28 Apr 2026
- Argus, Energy security fears drive diversification spend: IEA (World Energy Investment 2026), 28 May 2026, and Hormuz shipping update, 6 Nov 2026; IEA, World Energy Investment 2026; IEA, AI and data-centre electricity demand, 10 Apr 2025
- Federal Reserve, FOMC statement, 16 Sep 2026; IRS, Residential Clean Energy Credit; IRS, Notice 2025-42, 15 Aug 2025; CSIS, nuclear executive orders, May 2025
- Bloomberg Intelligence, ETFs to watch during the war in Iran, 3 Mar 2026; ESG Today (Morningstar data), US sustainable fund flows turn positive, 3 Aug 2026; CNBC, solar stocks after the midterms, 5 Nov 2026; Reuters, Oil set for sharp weekly drop, 6 Nov 2026
- ETF closures: Direxion via Yahoo Finance, Direxion closing three ETFs, 21 Jun 2024; Goldman Sachs via StockTitan, liquidation of three ETFs, 12 Dec 2024; Defiance, HDRO liquidation supplement, Apr 2025
- European Commission, answer on PRIIPs and US ETFs, 27 Jan 2022; justETF profiles for XDW0, WNRG, NUCL, Sep 2026
- National Bank of Ukraine, package of FX easing measures and Resolution No. 90, 10 Aug 2026; FX liberalisation roadmap, May 2026; NSSMC, five more foreign ETFs admitted, Aug 2026