
What Is Solargis Monitor?
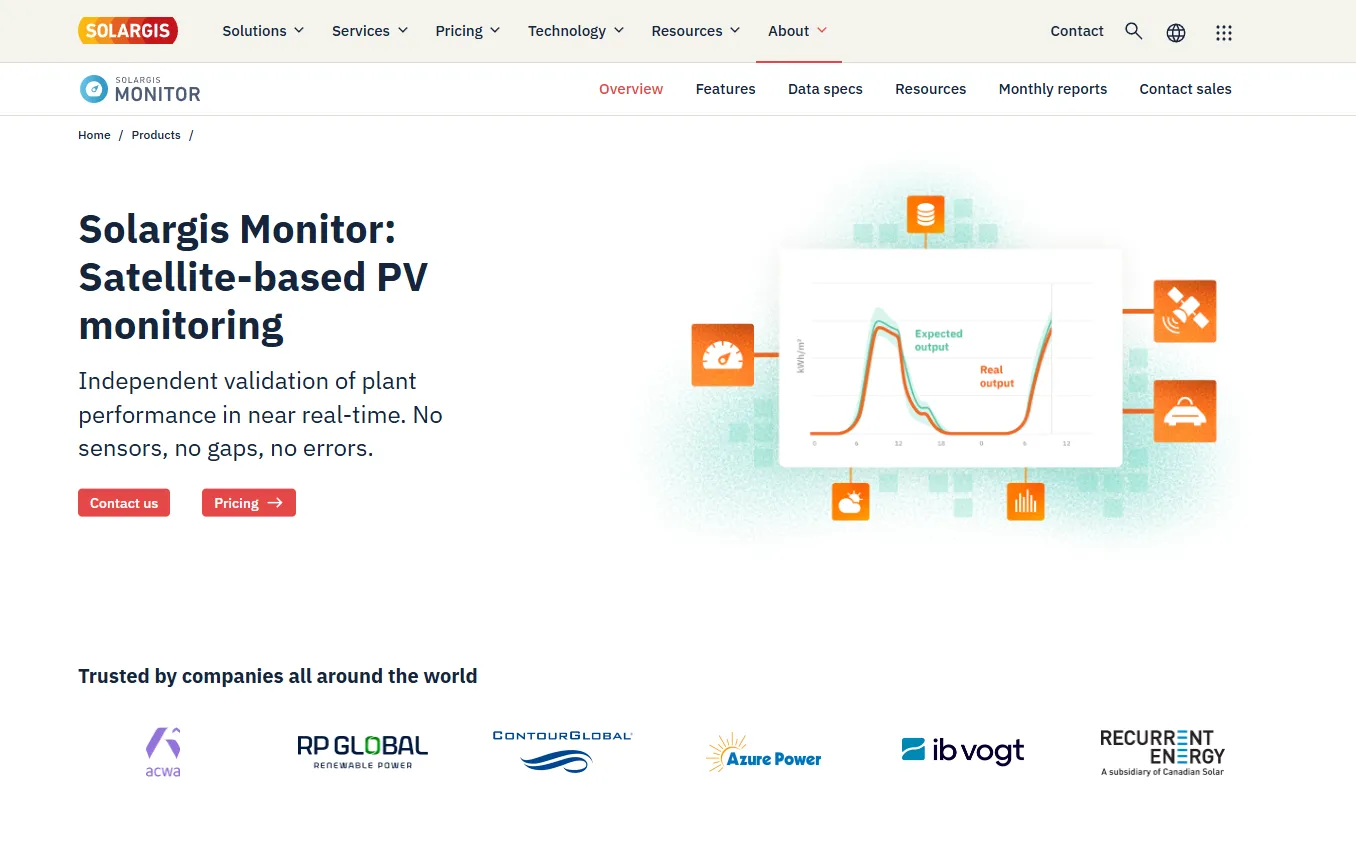
Solargis Monitor is a satellite-based solar monitoring and meteorological data service from Solargis. It combines Solargis satellite irradiance with weather data, mostly from ERA5, and models tilted irradiance (GTI) and PV output (PVOUT) for each site.
It is a data feed, not a dashboard: the numbers go into your monitoring system, asset management platform or analytics tool. Forecasts are a separate product (Solargis Forecast), as is long-term design data (Prospect and Evaluate). Coverage spans land and coastal seas from 56°S to 60°N, extended to 65°N in Scandinavia and the Americas.
Solargis Monitor answers a routine asset-management question: did a plant produce less because of the weather, or because something is wrong with it? For each site it supplies satellite-derived irradiance, weather data and modelled PV output (PVOUT) to set against metered production. On-site pyranometers answer the same question, but they need cleaning, calibration and gap-filling, and on small rooftop and C&I sites they are rarely worth installing.
It is built for asset managers, operations and maintenance providers, performance engineers and portfolio owners who already run a monitoring platform and need an independent irradiance reference. Where on-site measurement is impractical, it replaces sensors; on large plants, where IEC 61724-1 measurement is standard practice, it serves as a cross-check and gap-free baseline.
Pros and Cons
Pros
- No pyranometers to buy, clean and calibrate where on-site measurement is impractical.
- One satellite model for every site makes PR comparable across countries.
- About 90 m irradiance resolution reflects the plant's own location, not a regional average.
- Optional Real-Time updates every 5–15 minutes reveal outages the same day, not the next.
- Weather correction compares recent and long-term data from the same Solargis model, so budget-vs-actual checks stay consistent.
- No manual patching of sensor gaps before monthly PR reports.
- Listed integration partners (Power Factors, QOS Energy, GreenPowerMonitor) can cut custom integration work.
Cons
- No published prices, even for the 5-site base plans.
- At a single site, satellite estimates can differ from a clean, calibrated pyranometer.
- No dashboard: you need a platform that supports Solargis or a developer to parse XML or CSV.
- Only 3 or 12 months of rolling history; multi-year baselines need Solargis Evaluate.
- No coverage beyond 60°N (65°N in Scandinavia and the Americas) or 56°S.
Features
Satellite-Based Irradiance Reference
GHI, DNI, DIF and GTI at about 90 m resolution with horizon shading, plus modelled PV output for fixed-mount and, from Professional up, tracker systems.
Near Real-Time Data Delivery
With the Real-Time option, irradiance and PV output update every 5–15 minutes depending on region (weather parameters every six hours); standard plans deliver data up to the previous day.
Gap-Free Time Series
Every time step has a value, with no outages to patch before calculations.
Monthly Data Reanalysis
Each month's data is recalculated after month end for higher accuracy; the reanalyzed dataset is available from the 3rd day of the following month.
Meteorological Parameters
20+ solar, meteorological and environmental parameters, including air temperature (about 1 km grid), wind speed (about 11 km) and snow depth as water equivalent; Basic gets a core subset.
Probability and Clear-Sky Metrics
P10/P90 estimates for GHI, GTI and PVOUT, clear-sky irradiance, and clear-sky (KC) and clearness (KT) indices; not in Basic.
Solargis Monitor Pricing
Solargis Monitor uses a custom subscription model based on portfolio size, data resolution, and service requirements.
Trial and Samples: Trials are set up on request (no self-serve sign-up); sample data and a sample report are downloadable.
Basic Plans: Hourly data up to the previous day, 3 months of history, fixed-mount systems only; aimed at C&I and rooftop sites.
Professional Plans: Provide sub-hourly (5–15-minute) time steps, tracker support, the full parameter set and 12 months of history; data still updates daily unless real-time is added.
Enterprise Packages: Designed for large portfolios, resellers and custom reporting, with real-time updates and a dedicated account manager included.
Usage-Based Pricing: Each tier's base plan covers up to 5 sites a year; larger volumes are quoted.
Integrations
Every tier includes both API and SFTP delivery.
- REST API: Returns XML from the shared Monitor & Forecast endpoint, with token authentication.
- SFTP Delivery: Daily and monthly CSV pushes to your own or a Solargis-hosted folder, configured from one Excel request file.
- PVsyst Import: PVsyst has a built-in Solargis format for TMY, time series and monthly data, which Solargis supplies through Prospect and Evaluate rather than Monitor.
- RatedPower Compatibility: RatedPower imports Solargis hourly and monthly resource data for plant design; this uses Solargis long-term data, not Monitor feeds.
- Monitoring and Asset Management Platforms: Solargis lists integration partners including Power Factors, QOS Energy, GreenPowerMonitor and SolarEdge.
How to Set Up Solargis Monitor
- Contact Solargis to define monitoring requirements and portfolio scope.
- Provide site coordinates and PV system details (capacity, module type, mounting or trackers, tilt, azimuth).
- Choose API or SFTP delivery; for SFTP, fill in the Solargis Excel request template.
- Receive authentication credentials and integration documentation.
- Configure monitoring platforms to ingest Solargis data.
- Validate performance calculations against operational plant data.
How to Use Solargis Monitor
Once integrated, Monitor refreshes each site's irradiance, weather and PVOUT data daily, or every 5–15 minutes with Real-Time. Asset managers compare metered output with PVOUT, which shows what the plant should have produced under the weather it actually had.
When output drops, the comparison shows whether irradiance fell with it (weather) or the plant underperformed in normal sun (a fault). The 3- or 12-month rolling history covers monthly and quarterly reporting to owners and investors; multi-year baselines come from Solargis Evaluate. For contractual figures and audits, use the monthly reanalysis.
What You Can Manage with Solargis Monitor
- Performance Ratio Calculations: Benchmark actual production against independent solar resource data.
- Asset Performance Monitoring: Flag sites whose output trails modelled PVOUT, including hidden losses such as soiling or tracker misalignment.
- Portfolio Benchmarking: Compare solar assets across different geographic regions.
- Operational Reporting: PDF and CSV portfolio summary reports, an add-on on every tier.
- Data Validation: Quality control and gap-filling of on-site pyranometer data (Professional and Enterprise add-on).
- Budget vs. Actual Analysis: Compare expected production from recent Solargis data with budgeted production using the weather correction factor and weather-corrected PR (Enterprise add-ons).
FAQs
What does Solargis Monitor do?
It delivers satellite irradiance, weather data and modelled PV output for each site by API or SFTP, so you can tell weather losses from plant faults and calculate performance ratio against an independent reference.
Who is Solargis Monitor best for?
Asset managers, O&M providers, performance analysts and utilities that need an independent irradiance reference for PR. Basic suits C&I and rooftop fixed-mount sites, Professional utility-scale and tracker plants. It is not for teams wanting a ready-made dashboard.
Is Solargis Monitor free?
No. It is a paid subscription; Solargis sets up a trial on request, and sample data and a sample report can be downloaded from the product page.
How much does Solargis Monitor cost?
Solargis publishes no prices. Each tier's base plan covers up to 5 sites a year; quotes depend on site count, time step, history and add-ons such as Real-Time.
What are the main limitations of Solargis Monitor?
It is a data feed without its own dashboard, prices are quote-only, history is a rolling 3 or 12 months, high-latitude sites are not covered, and at a single site satellite estimates can differ from a well-kept pyranometer.
What are the best alternatives to Solargis Monitor?
Popular alternatives include Solcast, SolarAnywhere, Meteonorm, Vaisala solar resource services, and other satellite-based irradiance and weather data providers.


